ComEd 2013 Annual Report Download - page 36
Download and view the complete annual report
Please find page 36 of the 2013 ComEd annual report below. You can navigate through the pages in the report by either clicking on the pages listed below, or by using the keyword search tool below to find specific information within the annual report.-
 1
1 -
2
-
3
-
4
-
5
-
6
-
7
-
8
-
9
-
10
-
11
-
12
-
13
-
14
-
15
-
16
-
17
-
18
-
19
-
20
-
21
-
22
-
23
-
24
-
25
-
 26
26 -
 27
27 -
 28
28 -
 29
29 -
 30
30 -
 31
31 -
 32
32 -
 33
33 -
 34
34 -
 35
35 -
 36
36 -
 37
37 -
 38
38 -
 39
39 -
 40
40 -
 41
41 -
 42
42 -
 43
43 -
 44
44 -
 45
45 -
 46
46 -
47
-
48
-
49
-
50
-
51
-
52
-
53
-
54
-
55
-
56
-
57
-
58
-
59
-
60
-
61
-
62
-
63
-
64
-
65
-
66
-
67
-
68
-
69
-
70
-
71
-
72
-
73
-
74
-
75
-
76
-
77
-
78
-
79
-
80
-
81
-
82
-
83
-
84
-
85
-
86
-
87
-
88
-
89
-
90
-
91
-
92
-
93
-
94
-
95
-
96
-
97
-
98
-
99
-
100
-
101
-
102
-
103
-
104
-
105
-
106
-
107
-
108
-
109
-
110
-
111
-
112
-
113
-
114
-
115
-
116
-
117
-
118
-
119
-
120
-
121
-
122
-
123
-
124
-
125
-
126
-
127
-
128
-
129
-
130
-
131
-
132
-
133
-
134
-
135
-
136
-
137
-
138
-
139
-
140
-
141
-
142
-
143
-
144
-
145
-
146
-
147
-
148
-
149
-
150
-
151
-
152
-
153
-
154
-
155
-
156
-
157
-
158
-
159
-
160
-
161
-
162
-
163
-
164
-
165
-
166
-
167
-
168
-
169
-
170
-
171
-
172
-
173
-
174
-
175
-
176
-
177
-
178
-
179
-
180
-
181
-
182
-
183
-
184
-
185
-
186
-
187
-
188
-
189
-
190
-
191
-
192
-
193
-
194
-
195
-
196
-
197
-
198
-
199
-
200
-
201
-
202
-
203
-
204
-
205
-
206
-
207
-
208
-
209
-
210
-
211
-
212
-
213
-
214
-
215
-
216
-
217
-
218
-
219
-
220
-
221
-
222
-
223
-
224
-
225
-
226
-
227
-
228
-
229
-
230
-
231
-
232
-
233
-
234
-
235
-
236
-
237
-
238
-
239
-
240
-
241
-
242
-
243
-
244
-
245
-
246
-
247
-
248
-
249
-
250
-
251
-
252
-
253
-
254
-
255
-
256
-
257
-
258
-
259
-
260
 |
 |

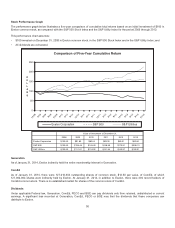
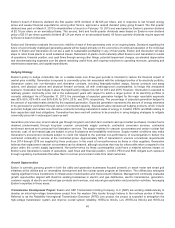
Stock Performance Graph
The performancegraphbelowillustratesafive-year comparison ofcumulative total returnsbasedon an initial investment of$100 in
Exelon common stock, ascomparedwiththeS&P 500 Stock IndexandtheS&P UtilityIndexfor the period2009through 2013.
This performancechart assumes:
•$100 investedon December 31,2008inExelon common stock, intheS&P 500 Stock IndexandintheS&P UtilityIndex; and
•All dividends are reinvested.
Comparison of Five-Year Cumulative Return
0
100
50
200
150
250
12/08
3/09
6/09
9/09
12/09
3/10
6/10
9/10
12/10
3/11
6/11
9/11
12/11
3/12
6/12
9/12
12/12
3/13
6/13
9/13
12/13
D
O
L
L
A
R
S
Value of Investment at December 31,
$100.00
S&P Utilities
$100.00S&P 500
$100.00
Exelon Corporation
2013
20122011
2010
20092008
$162.31
$143.37
$141.54$118.02
$111.91
$228.10$172.31$148.55$145.49$126.45
$62.94$65.21$89.76$82.04$91.60
Exelon Corporation
S&P 500 S&P Utilities
Generation
AsofJanuary31,2014, Exelon indirectlyheldthe entire membershipinterestinGeneration.
ComEd
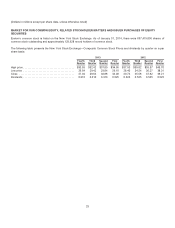
AsofJanuary31,2014, there were 127,016,904outstandingsharesofcommon stock, $12.50 par value,ofComEd, of which
127,002,904shareswere indirectlyheldbyExelon.At January31,2014, inaddition to Exelon,there were 294 recordholdersof
ComEd common stock. There is no establishedmarket for sharesofthecommon stock ofComEd.
Dividends
Under applicable Federal law, Generation,ComEd, PECO and BGE can pay dividends onlyfromretained, undistributedor current
earnings. Asignificant loss recordedat Generation,ComEd, PECO or BGE maylimitthedividends that thesecompaniescan
distribute to Exelon.
30