ComEd 2013 Annual Report Download - page 114
Download and view the complete annual report
Please find page 114 of the 2013 ComEd annual report below. You can navigate through the pages in the report by either clicking on the pages listed below, or by using the keyword search tool below to find specific information within the annual report.-
 1
1 -
2
-
3
-
4
-
5
-
6
-
7
-
8
-
9
-
10
-
11
-
12
-
13
-
14
-
15
-
16
-
17
-
18
-
19
-
20
-
21
-
22
-
23
-
24
-
25
-
26
-
27
-
28
-
29
-
30
-
31
-
32
-
33
-
34
-
35
-
36
-
37
-
38
-
39
-
40
-
41
-
42
-
43
-
44
-
45
-
46
-
47
-
48
-
49
-
50
-
51
-
52
-
53
-
54
-
55
-
56
-
57
-
58
-
59
-
60
-
61
-
62
-
63
-
64
-
65
-
66
-
67
-
68
-
69
-
70
-
71
-
72
-
73
-
74
-
75
-
76
-
77
-
78
-
79
-
80
-
81
-
82
-
83
-
84
-
85
-
86
-
87
-
88
-
89
-
90
-
91
-
92
-
93
-
94
-
95
-
96
-
97
-
98
-
99
-
100
-
101
-
102
-
103
-
 104
104 -
 105
105 -
 106
106 -
 107
107 -
 108
108 -
 109
109 -
 110
110 -
 111
111 -
 112
112 -
 113
113 -
 114
114 -
 115
115 -
 116
116 -
 117
117 -
 118
118 -
 119
119 -
 120
120 -
 121
121 -
 122
122 -
 123
123 -
 124
124 -
125
-
126
-
127
-
128
-
129
-
130
-
131
-
132
-
133
-
134
-
135
-
136
-
137
-
138
-
139
-
140
-
141
-
142
-
143
-
144
-
145
-
146
-
147
-
148
-
149
-
150
-
151
-
152
-
153
-
154
-
155
-
156
-
157
-
158
-
159
-
160
-
161
-
162
-
163
-
164
-
165
-
166
-
167
-
168
-
169
-
170
-
171
-
172
-
173
-
174
-
175
-
176
-
177
-
178
-
179
-
180
-
181
-
182
-
183
-
184
-
185
-
186
-
187
-
188
-
189
-
190
-
191
-
192
-
193
-
194
-
195
-
196
-
197
-
198
-
199
-
200
-
201
-
202
-
203
-
204
-
205
-
206
-
207
-
208
-
209
-
210
-
211
-
212
-
213
-
214
-
215
-
216
-
217
-
218
-
219
-
220
-
221
-
222
-
223
-
224
-
225
-
226
-
227
-
228
-
229
-
230
-
231
-
232
-
233
-
234
-
235
-
236
-
237
-
238
-
239
-
240
-
241
-
242
-
243
-
244
-
245
-
246
-
247
-
248
-
249
-
250
-
251
-
252
-
253
-
254
-
255
-
256
-
257
-
258
-
259
-
260
 |
 |

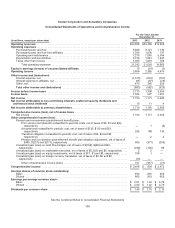
Exelon Corporation and Subsidiary Companies
Consolidated Statements of Operations and Comprehensive Income
For the Years Ended
December 31,
(In millions, except per share data) 2013 2012 2011
Operating revenues .................................................................. $24,888 $23,489 $19,063
Operating expenses ..................................................................
Purchasedpower andfuel .......................................................... 9,468 9,121 7,130
Purchasedpower andfuel fromaffiliates .............................................. 1,256 1,036137
Operatingandmaintenance......................................................... 7,2707,9615,184
Depreciation andamortization ....................................................... 2,1531,8811,347
Taxesother than income........................................................... 1,095 1,019 785
Total operatingexpenses ....................................................... 21,24221,01814,583
Equity in earnings (losses) of unconsolidated affiliates ................................... 10 (91)(1)
Operating income .................................................................... 3,656 2,3804,479
Other income and (deductions)
Interestexpense,net .............................................................. (1,315) (891)(701)
Interestexpensetoaffiliates, net ..................................................... (41)(37) (25)
Other,net ........................................................................ 473346 203
Total other income and (deductions) ............................................... (883) (582)(523)
Income before income taxes .......................................................... 2,7731,798 3,956
Income taxes ........................................................................ 1,044 6271,457
Net income .......................................................................... 1,7291,1712,499
Net income attributable to non-controlling interests, preferred security dividends and
preference stock dividends ......................................................... 10 11 4
Net income attributable to common shareholders ........................................ 1,7191,1602,495
Comprehensive income (loss), net of income taxes ......................................
Net income...................................................................... 1,7291,1712,499
Other comprehensive income (loss) ....................................................
Pension andnon-pension postretirement benefit plans:
Prior servicecost(benefit)reclassifiedto periodic costs, net oftaxesof$0,$1and $(4),
respectively ................................................................ — 1(5)
Actuarial loss reclassifiedto periodic cost,net oftaxesof$133,$110 and$93,
respectively ................................................................ 208168 136
Transition obligation reclassifiedto periodic cost,net oftaxesof$0,$2and$2,
respectively ................................................................ — 24
Pension andnon-pension postretirement benefit plan valuation adjustment,net oftaxesof
$430,$(237) and$(171), respectively ........................................... 669 (371)(250)
Unrealizedgain(loss) on cash flowhedges, net oftaxesof$(166), $(68) and$39,
respectively .................................................................... (248) (120)88
Unrealizedgain(loss) on marketable securities, net oftaxesof$0,$(1)and$0,respectively ... 22—
Unrealizedgain(loss) on equityinvestments, net oftaxesof$71,$1and$0,respectively...... 1061—
Unrealizedgain(loss) on foreigncurrency translation,net oftaxesof$0,$0and$0,
respectively .................................................................... (10)— —
Other comprehensiveincome(loss) .............................................. 727(317) (27)
Comprehensive income .............................................................. $ 2,456 $ 854 $ 2,472
Average shares of common stock outstanding:
Basic ........................................................................... 856 816663
Diluted .......................................................................... 860819 665
Earnings per average common share:
Basic ........................................................................... $ 2.01 $1.42$3.76
Diluted .......................................................................... $ 2.00 $1.42$3.75
Dividends per common share ......................................................... $ 1.46 $ 2.10 $2.10
See theCombinedNotesto ConsolidatedFinancial Statements
108