ComEd 2013 Annual Report Download - page 13
Download and view the complete annual report
Please find page 13 of the 2013 ComEd annual report below. You can navigate through the pages in the report by either clicking on the pages listed below, or by using the keyword search tool below to find specific information within the annual report.-
 1
1 -
2
-
 3
3 -
 4
4 -
 5
5 -
 6
6 -
 7
7 -
 8
8 -
 9
9 -
 10
10 -
 11
11 -
 12
12 -
 13
13 -
 14
14 -
 15
15 -
 16
16 -
 17
17 -
 18
18 -
 19
19 -
 20
20 -
 21
21 -
 22
22 -
 23
23 -
24
-
25
-
26
-
27
-
28
-
29
-
30
-
31
-
32
-
33
-
34
-
35
-
36
-
37
-
38
-
39
-
40
-
41
-
42
-
43
-
44
-
45
-
46
-
47
-
48
-
49
-
50
-
51
-
52
-
53
-
54
-
55
-
56
-
57
-
58
-
59
-
60
-
61
-
62
-
63
-
64
-
65
-
66
-
67
-
68
-
69
-
70
-
71
-
72
-
73
-
74
-
75
-
76
-
77
-
78
-
79
-
80
-
81
-
82
-
83
-
84
-
85
-
86
-
87
-
88
-
89
-
90
-
91
-
92
-
93
-
94
-
95
-
96
-
97
-
98
-
99
-
100
-
101
-
102
-
103
-
104
-
105
-
106
-
107
-
108
-
109
-
110
-
111
-
112
-
113
-
114
-
115
-
116
-
117
-
118
-
119
-
120
-
121
-
122
-
123
-
124
-
125
-
126
-
127
-
128
-
129
-
130
-
131
-
132
-
133
-
134
-
135
-
136
-
137
-
138
-
139
-
140
-
141
-
142
-
143
-
144
-
145
-
146
-
147
-
148
-
149
-
150
-
151
-
152
-
153
-
154
-
155
-
156
-
157
-
158
-
159
-
160
-
161
-
162
-
163
-
164
-
165
-
166
-
167
-
168
-
169
-
170
-
171
-
172
-
173
-
174
-
175
-
176
-
177
-
178
-
179
-
180
-
181
-
182
-
183
-
184
-
185
-
186
-
187
-
188
-
189
-
190
-
191
-
192
-
193
-
194
-
195
-
196
-
197
-
198
-
199
-
200
-
201
-
202
-
203
-
204
-
205
-
206
-
207
-
208
-
209
-
210
-
211
-
212
-
213
-
214
-
215
-
216
-
217
-
218
-
219
-
220
-
221
-
222
-
223
-
224
-
225
-
226
-
227
-
228
-
229
-
230
-
231
-
232
-
233
-
234
-
235
-
236
-
237
-
238
-
239
-
240
-
241
-
242
-
243
-
244
-
245
-
246
-
247
-
248
-
249
-
250
-
251
-
252
-
253
-
254
-
255
-
256
-
257
-
258
-
259
-
260
 |
 |

Exelon expectsthe projecttobeinfull commercial operation inthefirsthalfof2014. Theacquisition supportstheExelon
commitment to renewable energy aspart ofExelon 2020.The projecthasa25-year PPA,approvedbytheCPUC, withPacific
Gas&Electric Companyfor thefull output ofthe plant.Upon completion,thefacilitywill add 230 MWs to Generation’s renewable
generation fleet.Total capitalizedcostsfor thefacilityare expectedto be approximately$1.1billion.Total capitalizedcostsincurred
through December 31,2013 were approximately $968 million.
Wolf Hollow Generating Station. OnAugust24, 2011,Generation completedtheacquisition ofall oftheequityinterestsofWolf
Hollow, LLC (WolfHollow), acombined-cycle natural gas-firedpower plant in northTexas, for a purchasepriceof$311 million which
increasedGeneration’s ownedcapacitywithintheERCOT power market by 720 MWs.
See Note 4oftheCombinedNotesto ConsolidatedFinancial Statementsfor additional information on theaboveacquisitions.
Significant Dispositions
Maryland Clean Coal Stations. OnNovember 30,2012,asubsidiaryofGeneration soldtheBrandon Shoresgeneratingstation and
H.A.Wagner generatingstation in Anne Arundel County, Maryland, andtheC.P. Crane generatingstation inBaltimore County,
Marylandto Raven Power Holdings LLC, asubsidiaryofRiverstone Holdings LLC to complywithcertainoftheregulatoryapprovals
requiredbythemerger,for net proceeds ofapproximately$371million, which resultedin a pre-taxloss of$272million.See Note 4
oftheCombinedNotesto ConsolidatedFinancial Statementsfor additional information.
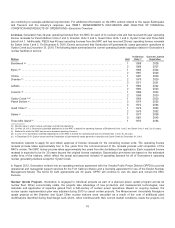
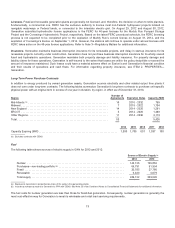
Generating Resources
At December 31,2013,thegeneratingresourcesofGeneration consistedofthefollowing:
Type of Capacity MW
Ownedgeneration assets(a)
Nuclear .................................................................................. 17,263
Fossil.................................................................................... 12,165
Renewable (including Hydroelectric) (b) ......................................................... 3,710
Ownedgeneration assets................................................................ 33,138
Long-termpower purchasecontracts(c) ............................................................ 9,426
Investment inCENG (d) ......................................................................... 1,999
Total generatingresources............................................................... 44,563
(a)See “Fuel”for sourcesoffuelsusedin electric generation.
(b) Includesequitymethodinvestment incertaingeneratingfacilities.
(c) Excludescontractswith CENG. See Long-TermPower PurchaseContractstable inthis section for additional information.
(d) Generation ownsa50.01%interestinCENG, ajoint venture with EDF. See ITEM 2.PROPERTIES—Generation andNote 25—RelatedPartyTransactionsofthe
CombinedNotesto ConsolidatedFinancial Statementsfor additional information.
Generation has six reportable segments, theMid-Atlantic, Midwest,NewEngland, NewYork, ERCOT andOther Regions,
representingthedifferent geographical areasinwhich Generation’s customer-facingactivitiesare conductedandwhere
Generation’s generatingresourcesare located.
• Mid-Atlantic representsoperationsintheeastern halfof PJM, which includesPennsylvania,NewJersey, Maryland, Virginia,
WestVirginia,Delaware,theDistrictofColumbiaandpartsofNorthCarolina (approximately37% ofcapacity).
• Midwest representsoperationsinthewestern halfof PJM, which includesportionsofIllinois, Indiana, Ohio, Michigan,Kentucky
andTennessee;andtheUnitedStatesfootprint of MISO excluding MISO’s Southern Region, which coversall or mostofNorth
Dakota,SouthDakota,Nebraska,Minnesota,Iowa, Wisconsin,andtheremainingpartsofIllinois, Indiana, Michigan and Ohio
not covered by PJM; andpartsofMontana, MissouriandKentucky (approximately34% ofcapacity).
•NewEnglandrepresentsthe operationswithinISO-NE coveringthestatesofConnecticut,Maine,Massachusetts, New
Hampshire,RhodeIslandandVermont (approximately8%ofcapacity).
•NewYorkrepresentsthe operationswithinISO-NY, which coversthestate ofNewYorkinitsentirety(approximately3%of
capacity).
7