ComEd 2013 Annual Report Download - page 69
Download and view the complete annual report
Please find page 69 of the 2013 ComEd annual report below. You can navigate through the pages in the report by either clicking on the pages listed below, or by using the keyword search tool below to find specific information within the annual report.-
 1
1 -
2
-
3
-
4
-
5
-
6
-
7
-
8
-
9
-
10
-
11
-
12
-
13
-
14
-
15
-
16
-
17
-
18
-
19
-
20
-
21
-
22
-
23
-
24
-
25
-
26
-
27
-
28
-
29
-
30
-
31
-
32
-
33
-
34
-
35
-
36
-
37
-
38
-
39
-
40
-
41
-
42
-
43
-
44
-
45
-
46
-
47
-
48
-
49
-
50
-
51
-
52
-
53
-
54
-
55
-
56
-
57
-
58
-
 59
59 -
 60
60 -
 61
61 -
 62
62 -
 63
63 -
 64
64 -
 65
65 -
 66
66 -
 67
67 -
 68
68 -
 69
69 -
 70
70 -
 71
71 -
 72
72 -
 73
73 -
 74
74 -
 75
75 -
 76
76 -
 77
77 -
 78
78 -
 79
79 -
80
-
81
-
82
-
83
-
84
-
85
-
86
-
87
-
88
-
89
-
90
-
91
-
92
-
93
-
94
-
95
-
96
-
97
-
98
-
99
-
100
-
101
-
102
-
103
-
104
-
105
-
106
-
107
-
108
-
109
-
110
-
111
-
112
-
113
-
114
-
115
-
116
-
117
-
118
-
119
-
120
-
121
-
122
-
123
-
124
-
125
-
126
-
127
-
128
-
129
-
130
-
131
-
132
-
133
-
134
-
135
-
136
-
137
-
138
-
139
-
140
-
141
-
142
-
143
-
144
-
145
-
146
-
147
-
148
-
149
-
150
-
151
-
152
-
153
-
154
-
155
-
156
-
157
-
158
-
159
-
160
-
161
-
162
-
163
-
164
-
165
-
166
-
167
-
168
-
169
-
170
-
171
-
172
-
173
-
174
-
175
-
176
-
177
-
178
-
179
-
180
-
181
-
182
-
183
-
184
-
185
-
186
-
187
-
188
-
189
-
190
-
191
-
192
-
193
-
194
-
195
-
196
-
197
-
198
-
199
-
200
-
201
-
202
-
203
-
204
-
205
-
206
-
207
-
208
-
209
-
210
-
211
-
212
-
213
-
214
-
215
-
216
-
217
-
218
-
219
-
220
-
221
-
222
-
223
-
224
-
225
-
226
-
227
-
228
-
229
-
230
-
231
-
232
-
233
-
234
-
235
-
236
-
237
-
238
-
239
-
240
-
241
-
242
-
243
-
244
-
245
-
246
-
247
-
248
-
249
-
250
-
251
-
252
-
253
-
254
-
255
-
256
-
257
-
258
-
259
-
260
 |
 |

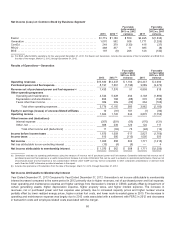
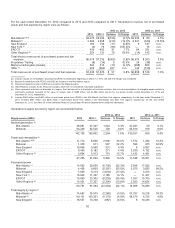
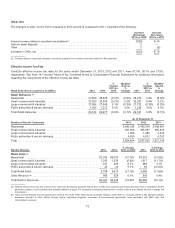
2013 vs. 2012 2012 vs. 2011
Supply source (GWh) 2013 2012 (a) Variance % Change 2011 Variance % Change
NewYork ............................... 13,64211,457 2,185 19.1%—11,457 n.m.
ERCOT ................................. 21,51629,484 (7,968) (27.0)% 9,567 19,917n.m.
Other Regions(e)......................... 21,595 23,240(1,645) (7.1)% 3,93519,305n.m.
Total supply ................................. 249,122 263,695 (14,573) (5.5)% 169,84393,85255.3%
(a)Includesresultsfor theConstellation business transferredto Generation beginningon March 12,2012,thedate themerger wascompleted.
(b) Includesthe proportionate share ofoutput where Generation hasan undividedownershipinterestinjointly-ownedgeneratingplantsanddoesnot includeownership
through equitymethodinvestments(e.g., CENG).
(c) Purchasedpower includesphysical volumesof12,067 GWh and 9,925 GWh intheMid-Atlantic and12,165 GWh and9,350GWh inNewYorkasaresult ofthePPA
with CENG for theyearsendedDecember 31,2013 and2012 respectively.
(d) Excludesgeneration under the reliability-must-run rate schedule andgeneration ofBrandon Shores, H.A.Wagner,and C.P. Crane,thegeneratingfacilities divested
inthefourthquarter of2012 asaresult oftheExelon andConstellation merger.
(e)Other RegionsincludesSouth, WestandCanada, which are not consideredindividually significant.
(f) Excludesphysical proprietarytradingvolumesof 8,762GWh, 12,958 GWh and 5,742GWh for theyearsendedDecember 31,2013,2012 and2011 respectively.
(g) Includessalesto PECO through thecompetitive procurement process of5,070GWh, 7,762GWh, and7,041GWh for theyearsendedDecember 31,2013,2012 and
2011 respectively. Salesto BGE of 5,595 GWh and3,766 GWh were includedfor theyearsendedDecember 31,2013 and2012 respectively.
(h) Includessalesto ComEd under theRFP procurement of 7,491GWh, 4,152GWh and 4,731 GWh for theyearsendedDecember 31,2013,2012 and2011
respectively.
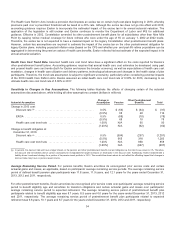
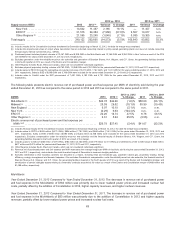
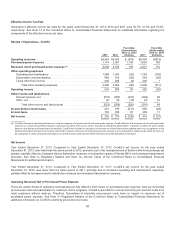
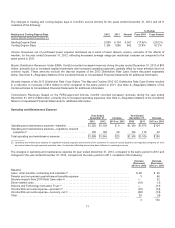
Thefollowingtable presentselectric revenue net ofpurchasedpower andfuel expense per MWh ofelectricitysoldduringtheyear
endedDecember 31,2013 ascomparedto thesame periodin 2012 and2012 ascomparedto thesame periodin 2011.
2013 vs. 2012 2012 vs. 2011
$/MWh 2013 2012 (a) % Change 2011 % Change
Mid-Atlantic (b) ................................................. $43.78 $44.60(1.8)% $58.00 (23.1)%
Midwest(c) .................................................... 26.0929.02 (10.1)% 35.99 (19.4)%
NewEngland .................................................. 9.97 10.19(2.1)% n.m. n.m.
NewYork ..................................................... (0.29) 6.63(104.4)% n.m. n.m.
ERCOT....................................................... 20.2613.74 47.5% 8.78 56.5%
Other Regions(d) ............................................... 9.31 5.64 65.0%(3.56) n.m.
Electric revenue net ofpurchasedpower andfuel expense per
MWh (e)(f) .................................................... $26.79 $27.45 (2.4)% $41.07(33.2)%
(a)Includesfinancial resultsfor theConstellation business transferredto Generation beginningon March 12,2012,thedate themerger wascompleted.
(b) Includessalesto PECO of$405million (5,070GWh), $536million (7,762GWh) and$508million (7,041GWh) for theyearsendedDecember 31,2013,2012 and
2011,respectively. Salesto BGE of $455 million (5,595 GWh) and$322 million (3,766 GWh) were includedfor theyearsendedDecember 31,2013 and2012
respectively. Excludescompensation under the reliability-must-run rate schedule andthefinancial resultsofBrandon Shores, H.A.Wagner,and C.P. Crane,the
generatingfacilities divestedinthefourthquarter of2012 asaresult ofthemerger.
(c) Includessalesto ComEd of$283million (7,491GWh), $162million (4,152GWh) and$179 million (4,731 GWhs) andsettlementsoftheComEd swap of$230 million,
$627million and $474 million for yearsendedDecember 31,2013,2012 and2011,respectively.
(d) Other RegionsincludesSouth, WestandCanada, which are not consideredindividually significant.
(e)Revenue net ofpurchasedpower andfuel expense per MWh representstheaveragemargin per MWh ofelectricitysoldduringtheyearsendedDecember 31,2013,
2012 and2011,respectively, andexcludesthemark-to-market impactofGeneration’s economic hedgingactivities.
(f) ExcludesGeneration’s other business activitiesnot allocatedto a region,includingretailandwholesale gas, upstreamnatural gas, proprietarytrading, energy
efficiency, energy management anddemandresponse.AlsoexcludesGeneration’s compensation under the reliability-must-run rate schedule,thefinancial resultsof
Brandon Shores, H.A.Wagner,and C.P. Crane,thegeneratingfacilities divestedinthefourthquarter of2012 asaresult oftheExelon andConstellation merger,and
amortization ofcertainintangible assetsrelatingto commoditycontractsrecordedat fairvalue asaresult oftheExelon andConstellation merger of $488 million and
$1,098 million,respectively.
Mid-Atlantic
Year Ended December 31, 2013 Compared to Year Ended December 31, 2012.Thedecreaseinrevenue net ofpurchasedpower
andfuel expenseintheMid-Atlantic of$163million wasprimarilydue to lower realizedpower pricesandincreasednuclear fuel
costs, partiallyoffset by theaddition ofConstellation in 2012, higher capacityrevenues, and higher nuclear revenues.
Year Ended December 31, 2012 Compared to Year Ended December 31, 2011.Theincreaseinrevenue net ofpurchasedpower
andfuel expenseintheMid-Atlantic of$83million wasprimarilydue to theaddition ofConstellation in 2012 and higher capacity
revenues, partiallyoffset by lower realizedpower pricesandincreasednuclear fuel costs.
63