ComEd 2013 Annual Report Download - page 59
Download and view the complete annual report
Please find page 59 of the 2013 ComEd annual report below. You can navigate through the pages in the report by either clicking on the pages listed below, or by using the keyword search tool below to find specific information within the annual report.-
 1
1 -
2
-
3
-
4
-
5
-
6
-
7
-
8
-
9
-
10
-
11
-
12
-
13
-
14
-
15
-
16
-
17
-
18
-
19
-
20
-
21
-
22
-
23
-
24
-
25
-
26
-
27
-
28
-
29
-
30
-
31
-
32
-
33
-
34
-
35
-
36
-
37
-
38
-
39
-
40
-
41
-
42
-
43
-
44
-
45
-
46
-
47
-
48
-
 49
49 -
 50
50 -
 51
51 -
 52
52 -
 53
53 -
 54
54 -
 55
55 -
 56
56 -
 57
57 -
 58
58 -
 59
59 -
 60
60 -
 61
61 -
 62
62 -
 63
63 -
 64
64 -
 65
65 -
 66
66 -
 67
67 -
 68
68 -
 69
69 -
70
-
71
-
72
-
73
-
74
-
75
-
76
-
77
-
78
-
79
-
80
-
81
-
82
-
83
-
84
-
85
-
86
-
87
-
88
-
89
-
90
-
91
-
92
-
93
-
94
-
95
-
96
-
97
-
98
-
99
-
100
-
101
-
102
-
103
-
104
-
105
-
106
-
107
-
108
-
109
-
110
-
111
-
112
-
113
-
114
-
115
-
116
-
117
-
118
-
119
-
120
-
121
-
122
-
123
-
124
-
125
-
126
-
127
-
128
-
129
-
130
-
131
-
132
-
133
-
134
-
135
-
136
-
137
-
138
-
139
-
140
-
141
-
142
-
143
-
144
-
145
-
146
-
147
-
148
-
149
-
150
-
151
-
152
-
153
-
154
-
155
-
156
-
157
-
158
-
159
-
160
-
161
-
162
-
163
-
164
-
165
-
166
-
167
-
168
-
169
-
170
-
171
-
172
-
173
-
174
-
175
-
176
-
177
-
178
-
179
-
180
-
181
-
182
-
183
-
184
-
185
-
186
-
187
-
188
-
189
-
190
-
191
-
192
-
193
-
194
-
195
-
196
-
197
-
198
-
199
-
200
-
201
-
202
-
203
-
204
-
205
-
206
-
207
-
208
-
209
-
210
-
211
-
212
-
213
-
214
-
215
-
216
-
217
-
218
-
219
-
220
-
221
-
222
-
223
-
224
-
225
-
226
-
227
-
228
-
229
-
230
-
231
-
232
-
233
-
234
-
235
-
236
-
237
-
238
-
239
-
240
-
241
-
242
-
243
-
244
-
245
-
246
-
247
-
248
-
249
-
250
-
251
-
252
-
253
-
254
-
255
-
256
-
257
-
258
-
259
-
260
 |
 |
pension andother postretirement benefitobligationsisrecognizedover time rather than immediatelyrecognizedintheincome
statement.Gainsor lossesinexcess ofthegreater often percent ofthe projectedbenefitobligation or theMRVofplan assetsare
amortizedover theexpectedaverageremainingservice periodofplan participants. Pension andother postretirement benefitcosts
attributedto the operatingcompaniesare labor costsandare ultimatelyallocatedto projectswithinthe operatingcompanies, some
of which are capitalized.
Pension andother postretirement benefit plan assetsincludeequitysecurities, including U.S. andinternational securities, and fixed
incomesecurities, aswell ascertain alternativeinvestment classessuch asreal estate,private equityandhedgefunds. See Note
16—Retirement BenefitsoftheCombinedNotesto ConsolidatedFinancial Statementsfor information on fairvalue measurementsof
pension andother postretirement plan assets, includingvaluation techniquesandclassification under thefairvalue hierarchy in
accordancewithauthoritativeguidance.
Expected Rate of Return on Plan Assets. The long-termexpectedrate ofreturn on plan assetsassumption usedincalculating
pension costswas 7.50%, 7.50%, and8.00%for 2013,2012 and2011,respectively. Theweightedaverageexpectedreturn on
assetsassumption usedincalculatingother postretirement benefitcostswas 6.45%, 6.68%, and7.08% in 2013,2012 and2011,
respectively. The pension trustactivityisnon-taxable, while other postretirement benefit trustactivityispartiallytaxable.Thecurrent
year EROAis basedon asset allocationsfromtheprior year end. In 2010,Exelon began implementation ofaliability-driven
investment strategy inorder to reducethevolatilityofitspension assetsrelativetoitspension liabilities. Asaresult ofthis
modification,over time,Exelon determinedthat itwill decreaseequityinvestmentsandincreaseinvestmentsinfixedincome
securitiesandalternativeinvestmentsinorder to achieveabalancedportfolioofliabilityhedgingandreturn-generatingassets. See
Note 16—Retirement BenefitsoftheCombinedNotesto ConsolidatedFinancial Statementsfor additional information regarding
Exelon’s asset allocations. Exelon usedan EROAof7.00%and 6.59% to estimate its2014pension andother postretirement benefit
costs, respectively.
Exelon calculatestheexpectedreturn on pension andother postretirement benefit plan assetsbymultiplyingtheEROAby theMRV
ofplan assetsat thebeginningoftheyear,takinginto consideration anticipatedcontributionsandbenefitpaymentsto bemade
duringtheyear.IndeterminingMRV, the authoritativeguidancefor pensionsandpostretirement benefitsallows theuseofeither fair
value or a calculatedvalue that recognizeschangesinfairvalue inasystematic andrational manner over not more than fiveyears.
For themajorityofpension plan assets, Exelon usesacalculatedvalue that adjustsfor 20%ofthedifferencebetween fairvalue and
expectedMRVofplan assets. Useofthis calculatedvalue approach enablesless volatile expectedasset returnsto berecognized
asacomponent ofpension costfromyear to year.For other postretirement benefit plan assetsandcertain pension plan assets,
Exelon usesfairvalue to calculate theMRV.
Actual asset returnshaveanimpactonthecostsreportedfor theExelon-sponsoredpension andother postretirement benefit plans.
Theactual asset returnsacross theRegistrants’ pension andother postretirement benefit plansfor theyear endedDecember 31,
2013 were 6.73%and11.41%, respectively, comparedto an expectedlong-termreturn assumption of 7.50%and 6.45%,
respectively.
Discount Rate. Thediscount ratesusedto determine the pension andother postretirement benefitobligationswere 4.80%and
4.90%, respectively, at December 31,2013.Thediscount ratesat December 31,2013 represent weighted-average ratesfor both
pension andother postretirement benefit plans. At December 31,2013 and2012,thediscount rateswere determinedbydeveloping
aspot rate curvebasedon theyieldto maturityofauniverseof high-qualitynon-callable (or callable withmakewhole provisions)
bonds with similar maturitiesto the relatedpension andother postretirement benefitobligations. Thespot ratesare usedto discount
theestimated distributionsunder the pension andother postretirement benefit plans. Thediscount rate is thesingle level rate that
producesthesameresult asthespot rate curve.Exelon utilizesan analytical tool developedbyitsactuariesto determine the
discount rates.
Thediscount rate assumptionsusedto determine theobligation at year endare usedto determine thecostfor thefollowingyear.
Exelon will usediscount ratesof 4.80%and 4.90%to estimate its2014pension andother postretirement benefitcosts, respectively.
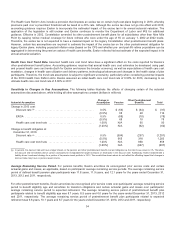
Health Care Reform Legislation. InMarch 2010,theHealthCare ReformActswere signedinto law, which containanumber of
provisionsthat impact retiree healthcare plansprovidedbyemployers. One such provision reducesthedeductibility, for Federal
incometaxpurposes, ofretiree healthcare coststo theextent an employer’s postretirement healthcare plan receivesFederal
subsidiesthat provide retiree prescription drugbenefitsat leastequivalent to thoseofferedbyMedicare.Although this changedid
not takeeffectimmediately, theRegistrantswere requiredto recognizethefull accountingimpactintheirfinancial statementsinthe
periodinwhich thelegislation wasenacted. Additionally, asaresult ofthis deductibilitychangefor employersandother HealthCare
Reformprovisionsthat impactthefederal prescription drugsubsidy optionsprovidedto employers, Exelon changedthemanner in
which itwill receive prescription drugsubsidiesbeginningin 2013.
53