ComEd 2013 Annual Report Download - page 157
Download and view the complete annual report
Please find page 157 of the 2013 ComEd annual report below. You can navigate through the pages in the report by either clicking on the pages listed below, or by using the keyword search tool below to find specific information within the annual report.-
 1
1 -
2
-
3
-
4
-
5
-
6
-
7
-
8
-
9
-
10
-
11
-
12
-
13
-
14
-
15
-
16
-
17
-
18
-
19
-
20
-
21
-
22
-
23
-
24
-
25
-
26
-
27
-
28
-
29
-
30
-
31
-
32
-
33
-
34
-
35
-
36
-
37
-
38
-
39
-
40
-
41
-
42
-
43
-
44
-
45
-
46
-
47
-
48
-
49
-
50
-
51
-
52
-
53
-
54
-
55
-
56
-
57
-
58
-
59
-
60
-
61
-
62
-
63
-
64
-
65
-
66
-
67
-
68
-
69
-
70
-
71
-
72
-
73
-
74
-
75
-
76
-
77
-
78
-
79
-
80
-
81
-
82
-
83
-
84
-
85
-
86
-
87
-
88
-
89
-
90
-
91
-
92
-
93
-
94
-
95
-
96
-
97
-
98
-
99
-
100
-
101
-
102
-
103
-
104
-
105
-
106
-
107
-
108
-
109
-
110
-
111
-
112
-
113
-
114
-
115
-
116
-
117
-
118
-
119
-
120
-
121
-
122
-
123
-
124
-
125
-
126
-
127
-
128
-
129
-
130
-
131
-
132
-
133
-
134
-
135
-
136
-
137
-
138
-
139
-
140
-
141
-
142
-
143
-
144
-
145
-
146
-
 147
147 -
 148
148 -
 149
149 -
 150
150 -
 151
151 -
 152
152 -
 153
153 -
 154
154 -
 155
155 -
 156
156 -
 157
157 -
 158
158 -
 159
159 -
 160
160 -
 161
161 -
 162
162 -
 163
163 -
 164
164 -
 165
165 -
 166
166 -
 167
167 -
168
-
169
-
170
-
171
-
172
-
173
-
174
-
175
-
176
-
177
-
178
-
179
-
180
-
181
-
182
-
183
-
184
-
185
-
186
-
187
-
188
-
189
-
190
-
191
-
192
-
193
-
194
-
195
-
196
-
197
-
198
-
199
-
200
-
201
-
202
-
203
-
204
-
205
-
206
-
207
-
208
-
209
-
210
-
211
-
212
-
213
-
214
-
215
-
216
-
217
-
218
-
219
-
220
-
221
-
222
-
223
-
224
-
225
-
226
-
227
-
228
-
229
-
230
-
231
-
232
-
233
-
234
-
235
-
236
-
237
-
238
-
239
-
240
-
241
-
242
-
243
-
244
-
245
-
246
-
247
-
248
-
249
-
250
-
251
-
252
-
253
-
254
-
255
-
256
-
257
-
258
-
259
-
260
 |
 |

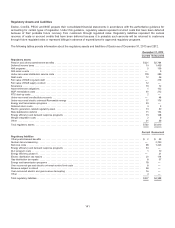
measure is basedupon certain unobservable inputs, which are consideredLevel 3 inputs, pursuant to applicable accounting
guidance.Keyestimatesandinputsincludeforecastedpower andfuel pricesandthediscount rate.Thefairvalue amountsare
amortizedover thelifeofthecontractin relation to the present value oftheunderlyingcash flows asofthemerger date.Amortization
expenseandincome are recordedthrough purchasedpower andfuel expense or operatingrevenues.
Exelon andGeneration present separatelyintheirConsolidatedBalanceSheetsthe unamortizedenergy contractassetsand
liabilitiesfor thesecontracts. Generation’s amortization expensefor theyear endedDecember 31,2013 amountedto $470million.
Generation’s amortization expensefor the periodMarch 12,2012 to December 31,2012 amountedto $1,101 million.Inaddition,
Exelon Corporate hasestablishedaregulatoryasset andan unamortizedenergy contractliabilityrelatedto BGE’s power supplyand
fuel contracts. Thepower supplyandfuel contractsregulatoryasset amortization was $77 million for theyear endedDecember 31,
2013 and$116million for the periodMarch 12,2012 to December 31,2012.An equallyoffsettingamortization ofthe unamortized
energy contractliabilityhasbeen recordedat Exelon Corporate intheConsolidatedStatement ofOperations.
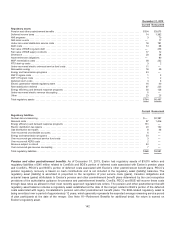
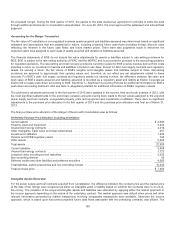
Thefairvalue oftheConstellation tradenameintangible asset wasdeterminedbasedon the relieffromroyaltymethodoftheincome
approach whereby fairvalue is determinedto bethe present value ofthelicensefeesavoidedbyowningtheassets. Themeasure is
basedupon certain unobservable inputs, which are consideredLevel 3 inputs, pursuant to applicable accountingguidance.Key
assumptionsincludethehypothetical royaltyrate andthediscount rate.Exelon’s andGeneration’s straightline amortization expense
for thefairvalue oftheConstellation tradenameintangible asset for theyear endedDecember 31,2013 andfor the period
March 12,2012 to December 31,2012 amountedto $26million and$20 million,respectively. The tradenameintangible asset is
includedindeferreddebitsandother assetswithinExelon’s andGeneration’s ConsolidatedBalanceSheets.
Thefairvalue ofthe retail relationshipswasdeterminedbasedon a “multi-periodexcess method” oftheincome approach. Under
this method, theintangible asset’s fairvalue is determinedto betheestimatedfuture cash flows that will be earnedon thecurrent
customer base,takinginto account expectedcontract renewalsbasedon customer attrition ratesandcoststo retainthose
customers. Themeasure is basedupon certain unobservable inputs, which are consideredLevel 3 inputs, pursuant to applicable
accountingguidance.Keyassumptionsincludethecustomer attrition rate andthediscount rate.Theintangible assetsfor thefair
value ofthe retail relationshipsare amortizedasamortization expenseonastraightline basis over theuseful lifeoftheunderlying
assets. Exelon’s andGeneration’s straightline amortization expensefor year endedDecember 31,2013 andfor the period
March 12,2012 to December 31,2012 amountedto $21 million and$15million,respectively. The retail relationshipsintangible
assetsare includedindeferreddebitsandother assetswithinExelon’s andGeneration’s ConsolidatedBalanceSheets.
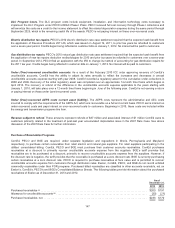
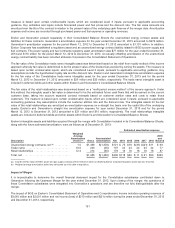
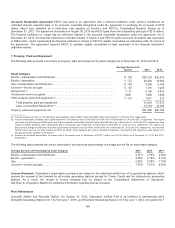
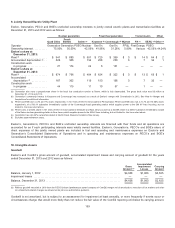
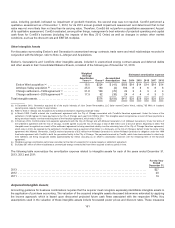
Exelon’s intangible assetsandliabilitiesacquiredthrough themerger withConstellation includedinitsConsolidatedBalanceSheets,
alongwiththefuture estimatedamortization,were asfollows asofDecember 31,2013:
Estimated amortization expense
Description
Weighted
Average
Amortization
(Years) (b) Gross
Accumulated
Amortization Net 2014 2015 2016 2017 2018
2019
and
Beyond
Unamortizedenergy contracts, net (a)........... 1.5 $1,499 $(1,378) $121 $75 $18$(31)$(21)$11 $69
Tradename................................ 10.0243(46) 197 242424242477
Retail relationships .......................... 12.4 214(36) 178 191818181887
Total,net .................................. $1,956 $(1,460) $496 $118$60$11 $21 $53$233
(a)Includesthefairvalue of BGE’s power andgassupplycontractsof$12 million for which an offsettingExelon Corporate regulatoryasset wasalsorecorded.
(b) Weightedaverageamortization periodwascalculatedasofthedate ofacquisition.
Impact of Merger
Itis impracticable to determine theoverall financial statement impactfor theConstellation subsidiariescontributeddownto
Generation followingtheUpstreamMerger for theyear endedDecember 31,2012.Upon closingofthemerger,the operationsof
theseConstellation subsidiarieswere integratedinto Generation’s operationsandare therefore not fully distinguishable after the
merger.
Theimpactof BGE on Exelon’s ConsolidatedStatement ofOperationsandComprehensiveIncomeincludesoperatingrevenuesof
$3,065 million and$2,091million andnet income(loss) of$210 million and$(31)million duringtheyearsendedDecember 31,2013
andDecember 31,2012,respectively.
151