ComEd 2013 Annual Report Download - page 76
Download and view the complete annual report
Please find page 76 of the 2013 ComEd annual report below. You can navigate through the pages in the report by either clicking on the pages listed below, or by using the keyword search tool below to find specific information within the annual report.-
 1
1 -
2
-
3
-
4
-
5
-
6
-
7
-
8
-
9
-
10
-
11
-
12
-
13
-
14
-
15
-
16
-
17
-
18
-
19
-
20
-
21
-
22
-
23
-
24
-
25
-
26
-
27
-
28
-
29
-
30
-
31
-
32
-
33
-
34
-
35
-
36
-
37
-
38
-
39
-
40
-
41
-
42
-
43
-
44
-
45
-
46
-
47
-
48
-
49
-
50
-
51
-
52
-
53
-
54
-
55
-
56
-
57
-
58
-
59
-
60
-
61
-
62
-
63
-
64
-
65
-
 66
66 -
 67
67 -
 68
68 -
 69
69 -
 70
70 -
 71
71 -
 72
72 -
 73
73 -
 74
74 -
 75
75 -
 76
76 -
 77
77 -
 78
78 -
 79
79 -
 80
80 -
 81
81 -
 82
82 -
 83
83 -
 84
84 -
 85
85 -
 86
86 -
87
-
88
-
89
-
90
-
91
-
92
-
93
-
94
-
95
-
96
-
97
-
98
-
99
-
100
-
101
-
102
-
103
-
104
-
105
-
106
-
107
-
108
-
109
-
110
-
111
-
112
-
113
-
114
-
115
-
116
-
117
-
118
-
119
-
120
-
121
-
122
-
123
-
124
-
125
-
126
-
127
-
128
-
129
-
130
-
131
-
132
-
133
-
134
-
135
-
136
-
137
-
138
-
139
-
140
-
141
-
142
-
143
-
144
-
145
-
146
-
147
-
148
-
149
-
150
-
151
-
152
-
153
-
154
-
155
-
156
-
157
-
158
-
159
-
160
-
161
-
162
-
163
-
164
-
165
-
166
-
167
-
168
-
169
-
170
-
171
-
172
-
173
-
174
-
175
-
176
-
177
-
178
-
179
-
180
-
181
-
182
-
183
-
184
-
185
-
186
-
187
-
188
-
189
-
190
-
191
-
192
-
193
-
194
-
195
-
196
-
197
-
198
-
199
-
200
-
201
-
202
-
203
-
204
-
205
-
206
-
207
-
208
-
209
-
210
-
211
-
212
-
213
-
214
-
215
-
216
-
217
-
218
-
219
-
220
-
221
-
222
-
223
-
224
-
225
-
226
-
227
-
228
-
229
-
230
-
231
-
232
-
233
-
234
-
235
-
236
-
237
-
238
-
239
-
240
-
241
-
242
-
243
-
244
-
245
-
246
-
247
-
248
-
249
-
250
-
251
-
252
-
253
-
254
-
255
-
256
-
257
-
258
-
259
-
260
 |
 |

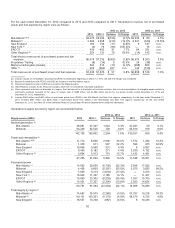
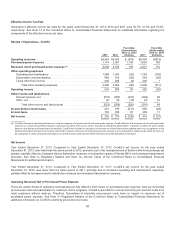
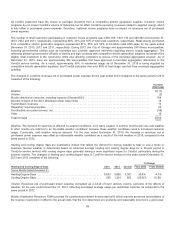
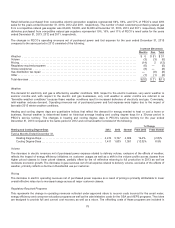
Distribution revenuesvaryfromyear to year basedupon fluctuationsintheunderlyingcosts, investmentsbeingrecoveredandother
billingdeterminants. Duringtheyear endedDecember 31,2013,ComEd recordedincreasedrevenuesof$168 million,primarilydue
to increasedcapital investments, increasedoperatingexpenses, and higher allowedreturn on common equity, includingtheimpacts
ofSenate Bill 9. Theseamountsexcludethediscrete impactsofthe 2012 Distribution Rate CaseOrders, discussedseparately
below. See Note 3—RegulatoryMattersoftheCombinedNotesto ConsolidatedFinancial Statementsfor additional information.
Discrete Impacts of the 2012 Distribution Rate Case Orders. OnOctober 3,2012,theICC issueditsfinal order relatedto ComEd’s
2011 formula rate proceedingunder EIMA(RehearingOrder), which reestablishedComEd’s position on the return on itspension
asset,resultinginanincreasetorevenuesin 2013.See Note 3—RegulatoryMattersoftheCombinedNotesto Consolidated
Financial Statementsfor additional information.
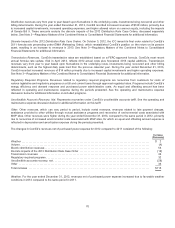
Transmission Revenues. ComEd’s transmission ratesare establishedbasedon a FERC-approvedformula.ComEd’s mostrecent
annual formula rate update,filedin April 2013,reflects2012 actual costsplusforecasted2013 capital additions. Transmission
revenuesvaryfromyear to year basedupon fluctuationsintheunderlyingcosts, investmentsbeingrecoveredandother billing
determinants, such asthehighestdailypeakloadfromthe previouscalendar year.Duringtheyear endedDecember 31,2013,
ComEd recordedincreasedrevenuesof$14million primarilydue to increasedcapital investmentsand higher operatingexpenses.
See Note 3—RegulatoryMattersoftheCombinedNotesto ConsolidatedFinancial Statementsfor additional information.
Regulatory Required Programs. Revenuesrelatedto regulatoryrequiredprograms are recoveriesfromcustomersfor costsof
variouslegislativeandregulatoryprograms on a full andcurrent basis through approvedregulatedrates. Programs includeComEd’s
energy efficiency anddemandresponseandpurchasedpower administrativecosts. An equal andoffsettingamount hasbeen
reflectedin operatingandmaintenanceexpenseduringthe periods presented. See the operatingandmaintenanceexpense
discussion belowfor additional information on includedprograms.
Uncollectible Accounts Recovery, Net. Representsrecoveriesunder ComEd’s uncollectible accountstariff. See the operatingand
maintenanceexpensediscussion belowfor additional information on this tariff.
Other. Other revenues, which can varyperiodto period, include rental revenues, revenuesrelatedto late payment charges,
assistance providedto other utilitiesthrough mutual assistance programs andrecoveriesofenvironmental costsassociatedwith
MGP sites. Other revenueswere higher duringtheyear endedDecember 31,2013,comparedto thesame periodin 2012,primarily
due to recoveriesofincreasedenvironmental costsassociatedwith MGP sites, for which an equal andoffsettingamount expenseis
reflectedindepreciation andamortization expenseduringthe periods presented.
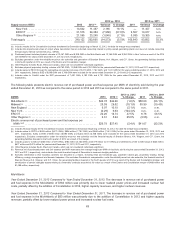
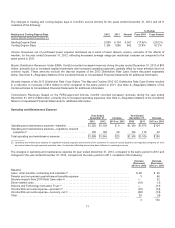
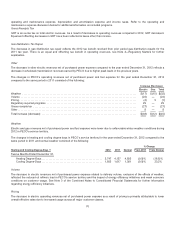
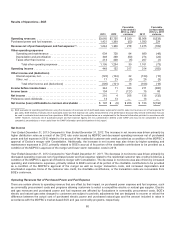
ThechangesinComEd’s revenuesnet ofpurchasedpower expensefor 2012 comparedto 2011 consistedofthefollowing:
Increase
(Decrease)
Weather ............................................................................................. $ 2
Volume.............................................................................................. (4)
Electric distribution revenues............................................................................ 53
Discrete impactsofthe 2012 Distribution Rate CaseOrder ................................................... (13)
Transmission revenues ................................................................................ 40
Regulatoryrequiredprograms ........................................................................... 32
Uncollectible accountsrecovery, net ...................................................................... (28)
Other ............................................................................................... 33
Total increase........................................................................................ $115
Weather. For theyear endedDecember 31,2012,revenuesnet ofpurchasedpower expenseincreaseddue to favorable weather
conditionsin 2012 comparedto thesame periodin 2011.
70