ComEd 2013 Annual Report Download - page 89
Download and view the complete annual report
Please find page 89 of the 2013 ComEd annual report below. You can navigate through the pages in the report by either clicking on the pages listed below, or by using the keyword search tool below to find specific information within the annual report.-
 1
1 -
2
-
3
-
4
-
5
-
6
-
7
-
8
-
9
-
10
-
11
-
12
-
13
-
14
-
15
-
16
-
17
-
18
-
19
-
20
-
21
-
22
-
23
-
24
-
25
-
26
-
27
-
28
-
29
-
30
-
31
-
32
-
33
-
34
-
35
-
36
-
37
-
38
-
39
-
40
-
41
-
42
-
43
-
44
-
45
-
46
-
47
-
48
-
49
-
50
-
51
-
52
-
53
-
54
-
55
-
56
-
57
-
58
-
59
-
60
-
61
-
62
-
63
-
64
-
65
-
66
-
67
-
68
-
69
-
70
-
71
-
72
-
73
-
74
-
75
-
76
-
77
-
78
-
 79
79 -
 80
80 -
 81
81 -
 82
82 -
 83
83 -
 84
84 -
 85
85 -
 86
86 -
 87
87 -
 88
88 -
 89
89 -
 90
90 -
 91
91 -
 92
92 -
 93
93 -
 94
94 -
 95
95 -
 96
96 -
 97
97 -
 98
98 -
 99
99 -
100
-
101
-
102
-
103
-
104
-
105
-
106
-
107
-
108
-
109
-
110
-
111
-
112
-
113
-
114
-
115
-
116
-
117
-
118
-
119
-
120
-
121
-
122
-
123
-
124
-
125
-
126
-
127
-
128
-
129
-
130
-
131
-
132
-
133
-
134
-
135
-
136
-
137
-
138
-
139
-
140
-
141
-
142
-
143
-
144
-
145
-
146
-
147
-
148
-
149
-
150
-
151
-
152
-
153
-
154
-
155
-
156
-
157
-
158
-
159
-
160
-
161
-
162
-
163
-
164
-
165
-
166
-
167
-
168
-
169
-
170
-
171
-
172
-
173
-
174
-
175
-
176
-
177
-
178
-
179
-
180
-
181
-
182
-
183
-
184
-
185
-
186
-
187
-
188
-
189
-
190
-
191
-
192
-
193
-
194
-
195
-
196
-
197
-
198
-
199
-
200
-
201
-
202
-
203
-
204
-
205
-
206
-
207
-
208
-
209
-
210
-
211
-
212
-
213
-
214
-
215
-
216
-
217
-
218
-
219
-
220
-
221
-
222
-
223
-
224
-
225
-
226
-
227
-
228
-
229
-
230
-
231
-
232
-
233
-
234
-
235
-
236
-
237
-
238
-
239
-
240
-
241
-
242
-
243
-
244
-
245
-
246
-
247
-
248
-
249
-
250
-
251
-
252
-
253
-
254
-
255
-
256
-
257
-
258
-
259
-
260
 |
 |

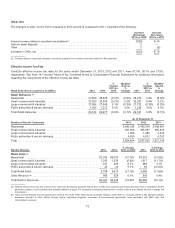
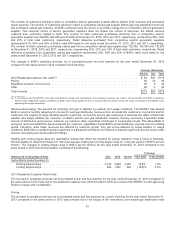
Transmission
Transmission revenuesincreasedduringtheyear endedDecember 31,2012 comparedto thesame periodin 2011 due to higher
revenue requirements. BGE’s transmission ratesare establishedbasedon a FERC-approvedformula.The ratesalsoinclude
transmission investment incentivesapprovedbyFERCinanumber oforderscoveringvariousnewtransmission investment projects
since 2007.
Other
Other revenuesdecreasedduringtheyear endedDecember 31,2012 comparedto thesame periodin 2011.Other revenues, which
can varyfromperiodto period, includemiscellaneousrevenuessuch asservice application andlate payment fees.
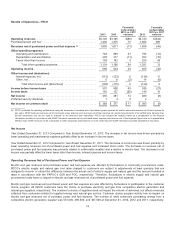
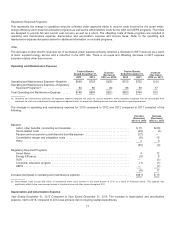
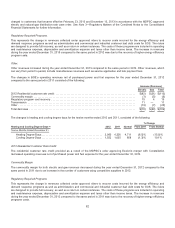
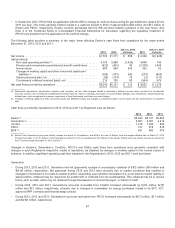
Operating and Maintenance Expense
Thechangesin operatingandmaintenanceexpensefor 2013 comparedto 2012 and2012 comparedto 2011 consistedofthe
following:
Increase
(Decrease)
2013 vs. 2012
Increase
(Decrease)
2012 vs. 2011
Charitable contributions(a)........................................................... $(28) $ 28
Stormcostsdeferral (b) .............................................................. — 16
Storm-relatedcosts(c) ............................................................... (62)7
Pension andnon-pension postretirement benefitsexpense................................ — 6
Labor,other benefits, contractingandmaterials.......................................... 20 (10)
Merger transaction costs(a)........................................................... (21) (9)
Other ............................................................................ (3)10
(Decrease)Increasein operatingandmaintenanceexpense................................... $(94) $ 48
(a)Duringthefirstquarter of2012, BGE accrued$28million incharitable contributionsasaresult of BGE’s merger-relatedcommitments. Thecharitable contribution
accrual andmerger costsare not recoverable from BGE’s customers.
(b) Duringthefirstquarter of2011,theMDPSC issuedacomprehensive rate order permittingthedeferral ofincremental distribution servicerestoration expenses
associatedwith2010 storms asaregulatoryasset.
(c) OnJune 29, 2012,a“Derecho”stormcausedextensivedamagetoBGE’s electric distribution systemandcreatedpower outagesthat lastedmultiple days. Asa
result, BGE incurred$62million ofincremental costsduringtheyear endedDecember 31,2012,of which $20 million are capital costs. Inthefourthquarter of2012,
BGE incurred$38million ofincremental costsasaresult ofHurricane Sandy, of which $14million are capital costs. Theseamountscompare to $40million of
incremental expensesincurredduringthethirdquarter of2011 associatedwithHurricane Irene,of which $25million are capital costs, and$14million ofincremental
expenses, of which $3 are capital costs, incurredduringthefirstquarter of2011.
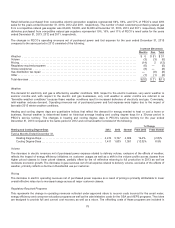
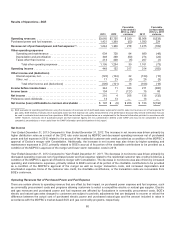
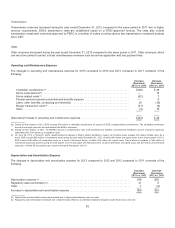
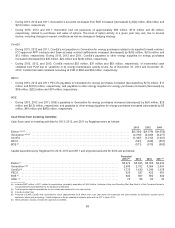
Depreciation and Amortization Expense
Thechangesindepreciation andamortization expensefor 2013 comparedto 2012 and2012 comparedto 2011 consistedofthe
following:
Increase
(Decrease)
2013 vs. 2012
Increase
(Decrease)
2012 vs. 2011
Depreciation expense(a)................................................................. $18$20
Regulatoryasset amortization (b) .......................................................... 31 6
Other ................................................................................ 1(2)
Increaseindepreciation andamortization expense........................................... $50$24
(a)Deprecation andamortization expenseincreaseddue to higher plant balancesyear over year.
(b) Regulatoryasset amortization increaseddue to higher energy efficiency anddemandresponse programs expendituresyear over year
83