ComEd 2013 Annual Report Download - page 66
Download and view the complete annual report
Please find page 66 of the 2013 ComEd annual report below. You can navigate through the pages in the report by either clicking on the pages listed below, or by using the keyword search tool below to find specific information within the annual report.-
 1
1 -
2
-
3
-
4
-
5
-
6
-
7
-
8
-
9
-
10
-
11
-
12
-
13
-
14
-
15
-
16
-
17
-
18
-
19
-
20
-
21
-
22
-
23
-
24
-
25
-
26
-
27
-
28
-
29
-
30
-
31
-
32
-
33
-
34
-
35
-
36
-
37
-
38
-
39
-
40
-
41
-
42
-
43
-
44
-
45
-
46
-
47
-
48
-
49
-
50
-
51
-
52
-
53
-
54
-
55
-
 56
56 -
 57
57 -
 58
58 -
 59
59 -
 60
60 -
 61
61 -
 62
62 -
 63
63 -
 64
64 -
 65
65 -
 66
66 -
 67
67 -
 68
68 -
 69
69 -
 70
70 -
 71
71 -
 72
72 -
 73
73 -
 74
74 -
 75
75 -
 76
76 -
77
-
78
-
79
-
80
-
81
-
82
-
83
-
84
-
85
-
86
-
87
-
88
-
89
-
90
-
91
-
92
-
93
-
94
-
95
-
96
-
97
-
98
-
99
-
100
-
101
-
102
-
103
-
104
-
105
-
106
-
107
-
108
-
109
-
110
-
111
-
112
-
113
-
114
-
115
-
116
-
117
-
118
-
119
-
120
-
121
-
122
-
123
-
124
-
125
-
126
-
127
-
128
-
129
-
130
-
131
-
132
-
133
-
134
-
135
-
136
-
137
-
138
-
139
-
140
-
141
-
142
-
143
-
144
-
145
-
146
-
147
-
148
-
149
-
150
-
151
-
152
-
153
-
154
-
155
-
156
-
157
-
158
-
159
-
160
-
161
-
162
-
163
-
164
-
165
-
166
-
167
-
168
-
169
-
170
-
171
-
172
-
173
-
174
-
175
-
176
-
177
-
178
-
179
-
180
-
181
-
182
-
183
-
184
-
185
-
186
-
187
-
188
-
189
-
190
-
191
-
192
-
193
-
194
-
195
-
196
-
197
-
198
-
199
-
200
-
201
-
202
-
203
-
204
-
205
-
206
-
207
-
208
-
209
-
210
-
211
-
212
-
213
-
214
-
215
-
216
-
217
-
218
-
219
-
220
-
221
-
222
-
223
-
224
-
225
-
226
-
227
-
228
-
229
-
230
-
231
-
232
-
233
-
234
-
235
-
236
-
237
-
238
-
239
-
240
-
241
-
242
-
243
-
244
-
245
-
246
-
247
-
248
-
249
-
250
-
251
-
252
-
253
-
254
-
255
-
256
-
257
-
258
-
259
-
260
 |
 |

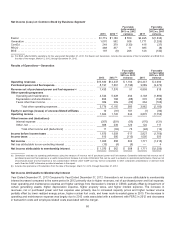
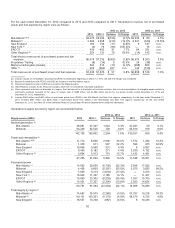
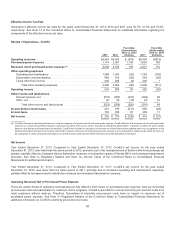
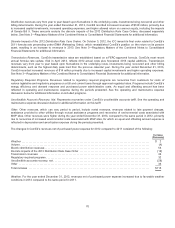
Net Income (Loss) on Common Stock by Business Segment
2013 2012 (a)
Favorable
(unfavorable)
2013 vs. 2012
variance 2011
Favorable
(unfavorable)
2012 vs. 2011
variance
Exelon ....................................................... $1,719$1,160$ 559 $2,495 $(1,335)
Generation .................................................... 1,0705625081,771(1,209)
ComEd ....................................................... 249 379 (130)416(37)
PECO ........................................................ 388 377 11 385 (8)
BGE ......................................................... 197 (9) 206123 (132)
(a)For BGE, reflects BGE’s operationsfor theyear endedDecember 31,2012.For Exelon andGeneration,includesthe operationsoftheConstellation and BGE from
thedate ofthemerger,March 12,2012,through December 31,2012.
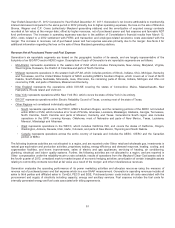
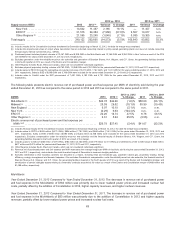
Results of Operations—Generation
2013 2012 (b)
Favorable
(unfavorable)
2013 vs. 2012
variance 2011
Favorable
(unfavorable)
2012 vs. 2011
variance
Operating revenues .......................................... $15,630 $14,437$1,193$10,447 $ 3,990
Purchased power and fuel expense ............................. 8,197 7,061(1,136) 3,589 (3,472)
Revenue net of purchased power and fuel expense (a) ............ 7,433 7,376 57 6,858 518
Other operating expenses
Operatingandmaintenance................................. 4,5345,028 494 3,148 (1,880)
Depreciation andamortization ............................... 856 768 (88) 570(198)
Taxesother than income.................................... 389 369 (20)264 (105)
Total other operatingexpenses........................... 5,779 6,165 386 3,982(2,183)
Equity in earnings (losses) of unconsolidated affiliates ........... 10 (91)101 (1)(90)
Operating income ............................................ 1,664 1,120 544 2,875 (1,755)
Other income and (deductions)
Interestexpense.......................................... (357) (301) (56) (170)(131)
Other,net ................................................ 368 239129122 117
Total other incomeand(deductions) ...................... 11 (62)73(48) (14)
Income before income taxes ................................... 1,675 1,058 6172,827(1,769)
Income taxes ................................................ 615500 (115) 1,056 556
Net income .................................................. 1,060558 502 1,771(1,213)
Net loss attributable to non-controllinginterest...................... (10) (4) (6) — 4
Net income attributable to membership interest .................. $ 1,070$562$508$1,771$(1,209)
(a)Generation evaluatesitsoperatingperformanceusingthemeasure ofrevenue net ofpurchasedpower andfuel expense.Generation believesthat revenue net of
purchasedpower andfuel expenseis auseful measurement becauseit providesinformation that can beusedto evaluate itsoperational performance.Revenue net
ofpurchasedpower andfuel expenseis not a presentation definedunder GAAPandmaynot becomparable to other companies’ presentationsor deemedmore
useful than theGAAPinformation providedelsewhere inthis report.
(b) Includesthe operationsofConstellation fromthedate ofthemerger,March 12,2012,through December 31,2012.
Net Income Attributable to Membership Interest
Year Ended December 31, 2013 Compared to Year Ended December 31, 2012. Generation’s net income attributable to membership
interestincreasedcomparedto thesame periodin 2012 primarilydue to higher revenues, net ofpurchasedpower andfuel expense,
lower operatingandmaintenanceexpenseand higher earnings fromGeneration’s interestinCENG; partiallyoffset by impairment of
certaingeneratingassets, higher depreciation expense, higher propertytaxes, and higher interestexpense.Theincreasein
revenues, net or purchasedpower andfuel expensewasprimarilydue to increasedcapacitypricesand higher nuclear volume
partiallyoffset by lower realizedenergy prices, higher nuclear fuel costs, andlower mark-to-market gainsin 2013.Thedecreasein
operatingandmaintenanceexpensewaslargelydue to 2012 costsassociatedwithasettlement withFERCin 2012 anddecreases
in transaction costsandemployee-relatedcostsassociatedwiththemerger.
60