ComEd 2013 Annual Report Download - page 88
Download and view the complete annual report
Please find page 88 of the 2013 ComEd annual report below. You can navigate through the pages in the report by either clicking on the pages listed below, or by using the keyword search tool below to find specific information within the annual report.-
 1
1 -
2
-
3
-
4
-
5
-
6
-
7
-
8
-
9
-
10
-
11
-
12
-
13
-
14
-
15
-
16
-
17
-
18
-
19
-
20
-
21
-
22
-
23
-
24
-
25
-
26
-
27
-
28
-
29
-
30
-
31
-
32
-
33
-
34
-
35
-
36
-
37
-
38
-
39
-
40
-
41
-
42
-
43
-
44
-
45
-
46
-
47
-
48
-
49
-
50
-
51
-
52
-
53
-
54
-
55
-
56
-
57
-
58
-
59
-
60
-
61
-
62
-
63
-
64
-
65
-
66
-
67
-
68
-
69
-
70
-
71
-
72
-
73
-
74
-
75
-
76
-
77
-
 78
78 -
 79
79 -
 80
80 -
 81
81 -
 82
82 -
 83
83 -
 84
84 -
 85
85 -
 86
86 -
 87
87 -
 88
88 -
 89
89 -
 90
90 -
 91
91 -
 92
92 -
 93
93 -
 94
94 -
 95
95 -
 96
96 -
 97
97 -
 98
98 -
99
-
100
-
101
-
102
-
103
-
104
-
105
-
106
-
107
-
108
-
109
-
110
-
111
-
112
-
113
-
114
-
115
-
116
-
117
-
118
-
119
-
120
-
121
-
122
-
123
-
124
-
125
-
126
-
127
-
128
-
129
-
130
-
131
-
132
-
133
-
134
-
135
-
136
-
137
-
138
-
139
-
140
-
141
-
142
-
143
-
144
-
145
-
146
-
147
-
148
-
149
-
150
-
151
-
152
-
153
-
154
-
155
-
156
-
157
-
158
-
159
-
160
-
161
-
162
-
163
-
164
-
165
-
166
-
167
-
168
-
169
-
170
-
171
-
172
-
173
-
174
-
175
-
176
-
177
-
178
-
179
-
180
-
181
-
182
-
183
-
184
-
185
-
186
-
187
-
188
-
189
-
190
-
191
-
192
-
193
-
194
-
195
-
196
-
197
-
198
-
199
-
200
-
201
-
202
-
203
-
204
-
205
-
206
-
207
-
208
-
209
-
210
-
211
-
212
-
213
-
214
-
215
-
216
-
217
-
218
-
219
-
220
-
221
-
222
-
223
-
224
-
225
-
226
-
227
-
228
-
229
-
230
-
231
-
232
-
233
-
234
-
235
-
236
-
237
-
238
-
239
-
240
-
241
-
242
-
243
-
244
-
245
-
246
-
247
-
248
-
249
-
250
-
251
-
252
-
253
-
254
-
255
-
256
-
257
-
258
-
259
-
260
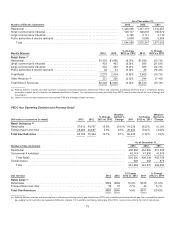
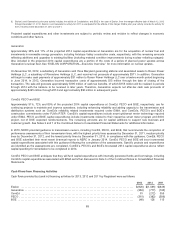
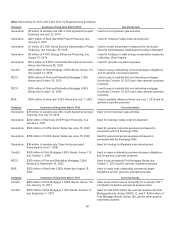
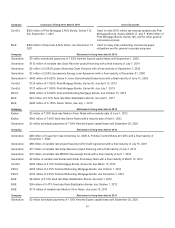
 |
 |

chargedto customersthat becameeffectiveFebruary23,2013 andDecember 13,2013 inaccordancewiththeMDPSC approved
electric andnatural gas distribution rate caseorder.See Note 3—RegulatoryMattersoftheCombinedNotesto theConsolidated
Financial Statementsfor further information.
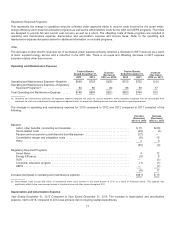
Regulatory Required Programs.
This representsthechangeinrevenuescollectedunder approvedridersto recover costsincurredfor the energy efficiency and
demandresponse programs aswell asadministrativeandcommercial andindustrial customer baddebtcostsfor SOS. Theriders
are designedto providefull recovery, aswell asa return incertaininstances. Thecostsofthese programs are includedin operating
andmaintenanceexpense,depreciation andamortization expenseandtaxesother than incometaxes. Theincreaseinrevenues
duringtheyear endedDecember 31,2013 comparedto thesame periodin 2012 wasdue to therecoveryof higher energy efficiency
programcosts.
Other.
Other revenuesincreasedduringtheyear endedDecember 31,2013 comparedto thesame periodin 2012.Other revenues, which
can varyfromperiodto period, includemiscellaneousrevenuessuch asservice application andlate payment fees.
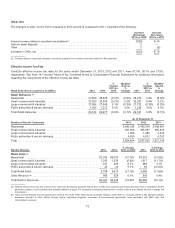
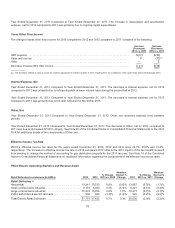
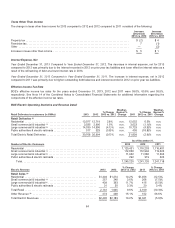
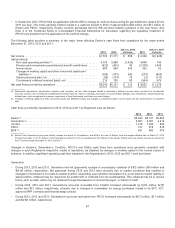
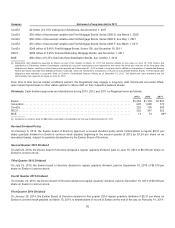
ThechangesinBGE’s operatingrevenuesnet ofpurchasedpower andfuel expensefor theyear endedDecember 31,2012
comparedto thesame periodin 2011 consistedofthefollowing:
Increase (Decrease)
Electric Gas Total
2012 Residential customer rate credit.......................................................... $(82)$(31)$(113)
Commoditymargin.......................................................................... (1) (5) (6)
Regulatoryprogramcostrecovery ............................................................. 15419
Transmission .............................................................................. 11 —11
Other ..................................................................................... (13) (7) (20)
Total decrease............................................................................. $(70)$(39) $(109)
Thechangesinheatingandcoolingdegree days for thetwelvemonths ended2012 and2011,consistedofthefollowing:
Heating and Cooling Degree-Days (a) 2012 2011 Normal
% Change
From 2011 From Normal
TwelveMonths EndedDecember 31,
HeatingDegree-Days............................................ 3,9604,326 4,711 (8.5)% (15.9)%
CoolingDegree-Days............................................ 1,022 1,035 858 (1.3)% 19.1%
2012 Residential Customer Rate Credit
Theresidential customer rate credit providedasaresult oftheMDPSC’s order approvingExelon’s merger withConstellation
decreasedoperatingrevenuesnet ofpurchasedpower andfuel expensefor theyear endedDecember 31,2012.
Commodity Margin
Thecommoditymarginfor bothelectric andgasrevenuesdecreasedduringtheyear endedDecember 31,2012 comparedto the
same periodin 2011 due to an increaseinthenumber ofcustomersusingcompetitivesuppliersin 2012.
Regulatory Required Programs
This representsthechangeinrevenuescollectedunder approvedridersto recover costsincurredfor the energy efficiency and
demandresponse programs aswell asadministrativeandcommercial andindustrial customer baddebtcostsfor SOS. Theriders
are designedto providefull recovery, aswell asa return incertaininstances. Thecostsofthese programs are includedin operating
andmaintenanceexpense,depreciation andamortization expenseandtaxesother than incometaxes. Theincreaseinrevenues
duringtheyear endedDecember 31,2012 comparedto thesame periodin 2011 wasdue to therecoveryof higher energy efficiency
programs costs.
82