ComEd 2013 Annual Report Download - page 91
Download and view the complete annual report
Please find page 91 of the 2013 ComEd annual report below. You can navigate through the pages in the report by either clicking on the pages listed below, or by using the keyword search tool below to find specific information within the annual report.-
 1
1 -
2
-
3
-
4
-
5
-
6
-
7
-
8
-
9
-
10
-
11
-
12
-
13
-
14
-
15
-
16
-
17
-
18
-
19
-
20
-
21
-
22
-
23
-
24
-
25
-
26
-
27
-
28
-
29
-
30
-
31
-
32
-
33
-
34
-
35
-
36
-
37
-
38
-
39
-
40
-
41
-
42
-
43
-
44
-
45
-
46
-
47
-
48
-
49
-
50
-
51
-
52
-
53
-
54
-
55
-
56
-
57
-
58
-
59
-
60
-
61
-
62
-
63
-
64
-
65
-
66
-
67
-
68
-
69
-
70
-
71
-
72
-
73
-
74
-
75
-
76
-
77
-
78
-
79
-
80
-
 81
81 -
 82
82 -
 83
83 -
 84
84 -
 85
85 -
 86
86 -
 87
87 -
 88
88 -
 89
89 -
 90
90 -
 91
91 -
 92
92 -
 93
93 -
 94
94 -
 95
95 -
 96
96 -
 97
97 -
 98
98 -
 99
99 -
 100
100 -
 101
101 -
102
-
103
-
104
-
105
-
106
-
107
-
108
-
109
-
110
-
111
-
112
-
113
-
114
-
115
-
116
-
117
-
118
-
119
-
120
-
121
-
122
-
123
-
124
-
125
-
126
-
127
-
128
-
129
-
130
-
131
-
132
-
133
-
134
-
135
-
136
-
137
-
138
-
139
-
140
-
141
-
142
-
143
-
144
-
145
-
146
-
147
-
148
-
149
-
150
-
151
-
152
-
153
-
154
-
155
-
156
-
157
-
158
-
159
-
160
-
161
-
162
-
163
-
164
-
165
-
166
-
167
-
168
-
169
-
170
-
171
-
172
-
173
-
174
-
175
-
176
-
177
-
178
-
179
-
180
-
181
-
182
-
183
-
184
-
185
-
186
-
187
-
188
-
189
-
190
-
191
-
192
-
193
-
194
-
195
-
196
-
197
-
198
-
199
-
200
-
201
-
202
-
203
-
204
-
205
-
206
-
207
-
208
-
209
-
210
-
211
-
212
-
213
-
214
-
215
-
216
-
217
-
218
-
219
-
220
-
221
-
222
-
223
-
224
-
225
-
226
-
227
-
228
-
229
-
230
-
231
-
232
-
233
-
234
-
235
-
236
-
237
-
238
-
239
-
240
-
241
-
242
-
243
-
244
-
245
-
246
-
247
-
248
-
249
-
250
-
251
-
252
-
253
-
254
-
255
-
256
-
257
-
258
-
259
-
260
 |
 |

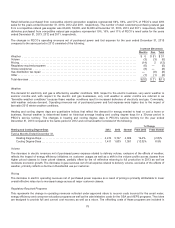
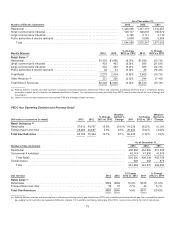
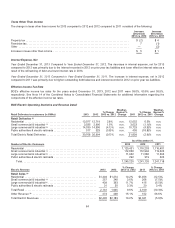
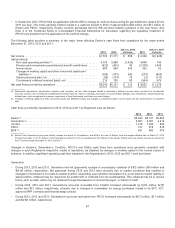
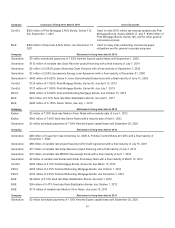
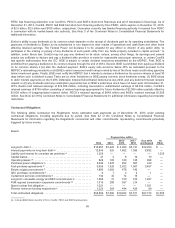
(a)Reflectsdeliveryrevenuesandvolumesfromcustomerspurchasingelectricitydirectlyfrom BGE andcustomerspurchasingelectricityfromacompetitive electric
generation supplier asall customersare assessed distribution charges. For customerspurchasingelectricityfrom BGE, revenue alsoreflectsthecostofenergy and
transmission.
(b) Other revenue includeswholesale transmission revenue andlate payment charges.
(c) Certaincommercial andindustrial (C&I) customerswere reclassifiedfromsmall C&I to largeC&I inprior yearsto conformto thecurrent year’s classification of C&I
customers.
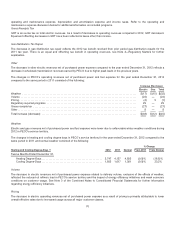
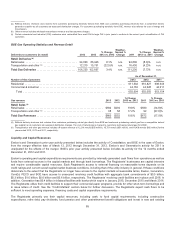
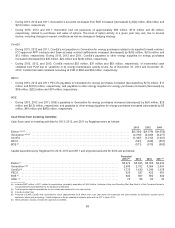
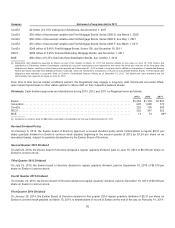
BGE Gas Operating Statistics and Revenue Detail
Deliveries to customers (in mmcf) 2013 2012
% Change
2013 vs. 2012
Weather-
Normal %
Change 2011
% Change
2012 vs. 2011
Weather-
Normal %
Change
Retail Deliveries (d)
Retailsales ..................................... 94,020 86,946 8.1%n.m. 94,800 (8.3)% n.m.
Transportation andother (e)........................ 12,210 15,751(22.5)% n.m. 16,436 (4.2)% n.m.
Total Gas Deliveries ............................. 106,230 102,697 3.4% n.m. 111,236 (7.7)% n.m.
As of December 31,
Number of Gas Customers 2013 2012 2011
Residential ......................................................................... 611,532 610,827608,943
Commercial &industrial .............................................................. 44,16244,228 44,211
Total .......................................................................... 655,694 655,055 653,154
Gas revenue 2013 2012
% Change
2013 vs. 2012 2011
% Change
2012 vs. 2011
Retail Sales (d)
Retailsales ........................................................ $592$494 19.8% $580(14.8)%
Transportation andother (e)........................................... 68 58 17.2%92(37.0)%
Total Gas Revenues ................................................ $660$55219.6% $672(17.9)%
(d) Reflectsdeliveryrevenuesandvolumesfromcustomerspurchasingnatural gasdirectlyfrom BGE andcustomerspurchasingnatural gasfromacompetitive natural
gassupplier asall customersare assessed distribution charges. Thecostofnatural gasischargedto customerspurchasingnatural gasfrom BGE.
(e)Transportation andother gasrevenue includesoff-systemrevenue of12,210 mmcfs ($55 million), 15,751mmcfs ($51million), and16,436 mmcfs ($82million)for the
yearsended2013,2012 and2011,respectively.
Liquidity and Capital Resources
Exelon’s andGeneration’s prior year activitypresentedbelowincludestheactivityofConstellation,and BGE inthecaseofExelon,
fromthemerger effectivedate ofMarch 12,2012 through December 31,2012.Exelon’s andGeneration’s activityfor 2011 is
unadjustedfor theeffectsofthemerger. BGE’s prior year activitypresentedbelowincludesitsactivityfor the12months ended
December 31,2012 and2011.
Exelon’s operatingandcapital expendituresrequirementsare providedbyinternallygeneratedcash flows fromoperationsaswell as
funds fromexternal sourcesinthecapital marketsandthrough bankborrowings. TheRegistrants’ businessesare capital intensive
andrequire considerable capital resources. Each Registrant’s access to external financingon reasonable terms depends on its
credit ratings andcurrent overall capital market business conditions, includingthat oftheutilityindustryingeneral.Iftheseconditions
deteriorate to theextent that theRegistrantsno longer haveaccess to thecapital marketsat reasonable terms, Exelon,Generation,
ComEd, PECO and BGE haveaccess to unsecuredrevolvingcreditfacilitieswithaggregate bankcommitmentsof$0.5 billion,
$5.3billion,$1.0billion,$0.6 billion and$0.6 billion,respectively. TheRegistrants’ revolvingcreditfacilitiesare in place until 2018. In
addition,Generation has$0.4 billion inbilateral facilitieswithbanks which expire inJanuary2015, December 2015andMarch 2016.
TheRegistrantsutilizetheircreditfacilitiesto support theircommercial paper programs, providefor other short-termborrowings and
to issue lettersofcredit.See the“CreditMatters” section belowfor further discussion.TheRegistrantsexpectcash flows to be
sufficient to meet operatingexpenses, financingcostsandcapital expenditure requirements.
TheRegistrantsprimarilyusetheircapital resources, includingcash, to fundcapital requirements, includingconstruction
expenditures, retire debt,pay dividends, fundpension andother postretirement benefitobligationsandinvestinnewandexisting
85