ComEd 2013 Annual Report Download - page 106
Download and view the complete annual report
Please find page 106 of the 2013 ComEd annual report below. You can navigate through the pages in the report by either clicking on the pages listed below, or by using the keyword search tool below to find specific information within the annual report.-
 1
1 -
2
-
3
-
4
-
5
-
6
-
7
-
8
-
9
-
10
-
11
-
12
-
13
-
14
-
15
-
16
-
17
-
18
-
19
-
20
-
21
-
22
-
23
-
24
-
25
-
26
-
27
-
28
-
29
-
30
-
31
-
32
-
33
-
34
-
35
-
36
-
37
-
38
-
39
-
40
-
41
-
42
-
43
-
44
-
45
-
46
-
47
-
48
-
49
-
50
-
51
-
52
-
53
-
54
-
55
-
56
-
57
-
58
-
59
-
60
-
61
-
62
-
63
-
64
-
65
-
66
-
67
-
68
-
69
-
70
-
71
-
72
-
73
-
74
-
75
-
76
-
77
-
78
-
79
-
80
-
81
-
82
-
83
-
84
-
85
-
86
-
87
-
88
-
89
-
90
-
91
-
92
-
93
-
94
-
95
-
 96
96 -
 97
97 -
 98
98 -
 99
99 -
 100
100 -
 101
101 -
 102
102 -
 103
103 -
 104
104 -
 105
105 -
 106
106 -
 107
107 -
 108
108 -
 109
109 -
 110
110 -
 111
111 -
 112
112 -
 113
113 -
 114
114 -
 115
115 -
 116
116 -
117
-
118
-
119
-
120
-
121
-
122
-
123
-
124
-
125
-
126
-
127
-
128
-
129
-
130
-
131
-
132
-
133
-
134
-
135
-
136
-
137
-
138
-
139
-
140
-
141
-
142
-
143
-
144
-
145
-
146
-
147
-
148
-
149
-
150
-
151
-
152
-
153
-
154
-
155
-
156
-
157
-
158
-
159
-
160
-
161
-
162
-
163
-
164
-
165
-
166
-
167
-
168
-
169
-
170
-
171
-
172
-
173
-
174
-
175
-
176
-
177
-
178
-
179
-
180
-
181
-
182
-
183
-
184
-
185
-
186
-
187
-
188
-
189
-
190
-
191
-
192
-
193
-
194
-
195
-
196
-
197
-
198
-
199
-
200
-
201
-
202
-
203
-
204
-
205
-
206
-
207
-
208
-
209
-
210
-
211
-
212
-
213
-
214
-
215
-
216
-
217
-
218
-
219
-
220
-
221
-
222
-
223
-
224
-
225
-
226
-
227
-
228
-
229
-
230
-
231
-
232
-
233
-
234
-
235
-
236
-
237
-
238
-
239
-
240
-
241
-
242
-
243
-
244
-
245
-
246
-
247
-
248
-
249
-
250
-
251
-
252
-
253
-
254
-
255
-
256
-
257
-
258
-
259
-
260
 |
 |

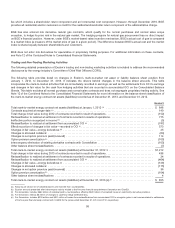
(f) For Generation,includes$146 million ofgainsrelatedto thechangesinfairvalue ofthefive-year financial swap withComEd for theyear ended2012. Effectiveprior
to themerger withConstellation,thefive-year financial swap between Generation andComEd wasde-designatedasacash flowhedge.Asaresult,all changesin
fairvalue for theyear endedDecember 31,2013 were recordedto operatingrevenuesandeliminatedinconsolidation.
(g) For ComEd, thechangesinfairvalue are recordedasachangeinregulatoryassetsor liabilities. AsofDecember 31,2013 and2012,ComEd recordedaregulatory
liabilityof$193million and$293million,respectively, relatedto itsmark-to-market derivativeliabilitieswithGeneration andunaffiliatedsuppliers. AsofDecember 31,
2013 and2012,this includes$11 million ofdecreasesand $98 million ofincreasesinfairvalue,respectively, and$215million and $566 million,respectively, for
reclassificationsfromregulatoryassetsto recognizecostin purchasepower expensedue to settlementsofComEd’s five-year financial swap withGeneration.Asof
December 31,2013 and2012 ComEd alsorecorded$126million and$34million,respectively, ofincreasesinfairvalue,and$7million and$5million,respectively,
ofrealizedlossesdue to settlementsassociatedwithfloating-to-fixedenergy swap contractswithunaffiliatedsuppliers.
(h) Includes$104million and$160million ofamountsreclassifiedto realizedat settlement ofcontractsrecordedto resultsofoperationsrelatedto option premiums due
to thesettlement oftheunderlyingtransactionsfor theyearsendedDecember 31,2013 and2012,respectively.
(i) Includestheendingbalance relatedto interest rate derivativecontractsandforeignexchangecurrency swapsto managetheexposure relatedto theinterest rate
component ofcommoditypositionsandinternational purchasesofcommoditiesincurrenciesother than U.S. Dollars.
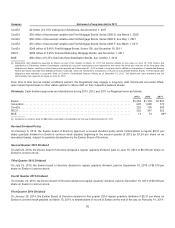
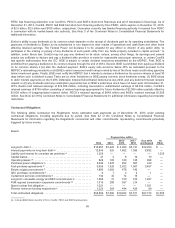
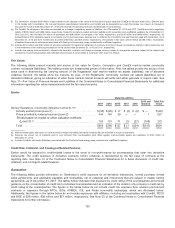
Fair Values
Thefollowingtablespresent maturityandsourceoffairvalue for Exelon,Generation andComEd mark-to-market commodity
contract net assets(liabilities). Thetablesprovidetwofundamental piecesofinformation.First,thetablesprovidethesourceoffair
value usedindeterminingthecarryingamount oftheRegistrants’ total mark-to-market net assets(liabilities), net ofallocated
collateral.Second, thetablesshowthematurity, by year,oftheRegistrants’ commoditycontract net assets(liabilities) net of
allocatedcollateral, givingan indication ofwhen thesemark-to-market amountswill settle andeither generate or require cash. See
Note 11—FairValue ofFinancial AssetsandLiabilitiesoftheCombinedNotesto ConsolidatedFinancial Statementsfor additional
information regardingfairvalue measurementsandthefairvalue hierarchy.
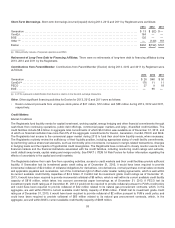
Exelon
Maturities Within
Total Fair
Value2014 2015 2016 2017 2018
2019 and
Beyond
Normal Operations, Commodity derivative contracts (a)(b):
Activelyquotedprices(Level 1) .............................. $(30)$(26) $ 17 $ (4) $ (2) $ — $ (45)
Pricesprovidedbyexternal sources(Level 2) .................. 444 14339— — 1627
Pricesbasedon model or other valuation methods
(Level 3)(c) ....................................... 155 1517125(22)(108) 272
Total .................................................... $569 $268 $127$21 $(24) $(107) $854
(a)Mark-to-market gainsandlosseson other economic hedgeandtradingderivativecontractsthat are recordedinresultsofoperations.
(b) Amountsare shown net ofcollateral paid to andreceivedfromcounterparties(andoffset againstmark-to-market assetsandliabilities) of$144 million at
December 31,2013.
(c) IncludesComEd’s net assets(liabilities) associatedwiththefloating-to-fixedenergy swap contractswithunaffiliatedsuppliers.
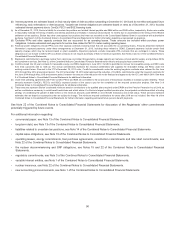
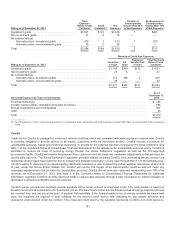
Credit Risk, Collateral, and Contingent Related Features
Exelon wouldbeexposedto credit-relatedlossesintheevent ofnon-performanceby counterpartiesthat enter into derivative
instruments. Thecreditexposure ofderivativecontracts, before collateral,isrepresentedbythefairvalue ofcontractsat the
reportingdate.See Note 12 oftheCombinedNotesto ConsolidatedFinancial Statementsfor a detaildiscussion ofcreditrisk,
collateral,andcontingent relatedfeatures.
Generation
Thefollowingtablesprovideinformation on Generation’s creditexposure for all derivativeinstruments, normal purchase normal
salesagreements, andapplicable payablesandreceivables, net ofcollateral andinstrumentsthat are subjecttomaster netting
agreements, asofDecember 31,2013.Thetablesfurther delineate that exposure by credit ratingofthecounterpartiesandprovide
guidanceontheconcentration ofcreditrisk to individual counterpartiesandan indication oftheduration ofacompany’s creditrisk by
credit ratingofthecounterparties. Thefiguresinthetablesbelowdo not includecreditrisk exposure fromuraniumprocurement
contractsor exposure through RTOs, ISOs, NYMEX, ICE, andNodal commodityexchanges, which are discussedbelow.
Additionally, thefiguresinthetablesbelowdo not includeexposureswithaffiliates, includingnet receivableswithComEd, PECO
and BGE of$38million,$38million and$27million,respectively. See Note 25oftheCombinedNotesto ConsolidatedFinancial
Statementsfor further information.
100