ComEd 2013 Annual Report Download - page 178
Download and view the complete annual report
Please find page 178 of the 2013 ComEd annual report below. You can navigate through the pages in the report by either clicking on the pages listed below, or by using the keyword search tool below to find specific information within the annual report.-
 1
1 -
2
-
3
-
4
-
5
-
6
-
7
-
8
-
9
-
10
-
11
-
12
-
13
-
14
-
15
-
16
-
17
-
18
-
19
-
20
-
21
-
22
-
23
-
24
-
25
-
26
-
27
-
28
-
29
-
30
-
31
-
32
-
33
-
34
-
35
-
36
-
37
-
38
-
39
-
40
-
41
-
42
-
43
-
44
-
45
-
46
-
47
-
48
-
49
-
50
-
51
-
52
-
53
-
54
-
55
-
56
-
57
-
58
-
59
-
60
-
61
-
62
-
63
-
64
-
65
-
66
-
67
-
68
-
69
-
70
-
71
-
72
-
73
-
74
-
75
-
76
-
77
-
78
-
79
-
80
-
81
-
82
-
83
-
84
-
85
-
86
-
87
-
88
-
89
-
90
-
91
-
92
-
93
-
94
-
95
-
96
-
97
-
98
-
99
-
100
-
101
-
102
-
103
-
104
-
105
-
106
-
107
-
108
-
109
-
110
-
111
-
112
-
113
-
114
-
115
-
116
-
117
-
118
-
119
-
120
-
121
-
122
-
123
-
124
-
125
-
126
-
127
-
128
-
129
-
130
-
131
-
132
-
133
-
134
-
135
-
136
-
137
-
138
-
139
-
140
-
141
-
142
-
143
-
144
-
145
-
146
-
147
-
148
-
149
-
150
-
151
-
152
-
153
-
154
-
155
-
156
-
157
-
158
-
159
-
160
-
161
-
162
-
163
-
164
-
165
-
166
-
167
-
 168
168 -
 169
169 -
 170
170 -
 171
171 -
 172
172 -
 173
173 -
 174
174 -
 175
175 -
 176
176 -
 177
177 -
 178
178 -
 179
179 -
 180
180 -
 181
181 -
 182
182 -
 183
183 -
 184
184 -
 185
185 -
 186
186 -
 187
187 -
 188
188 -
189
-
190
-
191
-
192
-
193
-
194
-
195
-
196
-
197
-
198
-
199
-
200
-
201
-
202
-
203
-
204
-
205
-
206
-
207
-
208
-
209
-
210
-
211
-
212
-
213
-
214
-
215
-
216
-
217
-
218
-
219
-
220
-
221
-
222
-
223
-
224
-
225
-
226
-
227
-
228
-
229
-
230
-
231
-
232
-
233
-
234
-
235
-
236
-
237
-
238
-
239
-
240
-
241
-
242
-
243
-
244
-
245
-
246
-
247
-
248
-
249
-
250
-
251
-
252
-
253
-
254
-
255
-
256
-
257
-
258
-
259
-
260
 |
 |

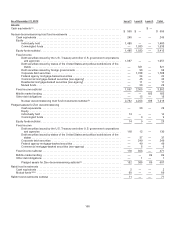
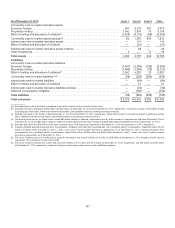
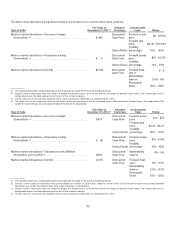
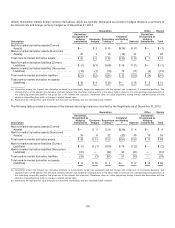
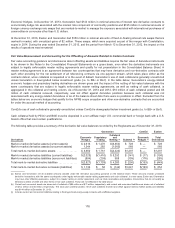
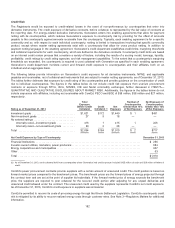
Thetable below disclosesthesignificant inputsto theforwardcurveusedto value thesepositions.
Type of trade
Fair Value at
December 31, 2013 (c)
Valuation
Technique
Unobservable
Input Range
Mark-to-market derivatives—Economic Hedges
(Generation)(a)........................................ $488
Discounted
Cash Flow
Forwardpower
price$8 - $176(d)
Forwardgas
price
Volatility
$2.98 - $16.63(d)
Option Model percentage15% - 142%
Mark-to-market derivatives—Proprietarytrading
(Generation)(a)........................................ $ 3
Discounted
Cash Flow
Forwardpower
price
Volatility
$10 -$176(d)
Option Model percentage14% - 19%
Mark-to-market derivatives(ComEd) ........................ $(193) Discounted
Cash Flow
Forwardheat
rate (b) 8-9
Marketability
reserve3.5% - 8%
Renewable
factor 84% -128%
a)Thevaluation techniques, unobservable inputsandrangesare thesamefor theasset andliabilitypositions.
b) Quotedforwardnatural gasratesare utilizedto projecttheforwardpower curvefor thedeliveryofenergy at specifiedfuture dates. The natural gascurveis
extrapolatedbeyonditsobservable periodto theendofthecontract’s delivery.
c) Thefairvaluesdo not includecash collateral heldon Level 3 positionsof$26million asofDecember 31,2013.
d) The upper ends ofthe rangesare driven by thewinter power andgaspricesintheNewEnglandregion.Without theNewEnglandregion,the upper ends ofthe
rangesfor power andgaswouldbe approximately$100 and $5.70,respectively.
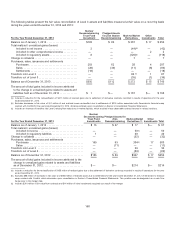
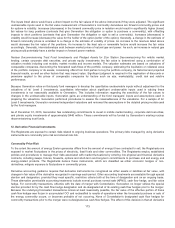
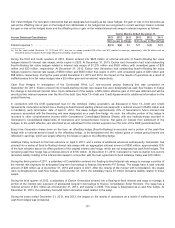
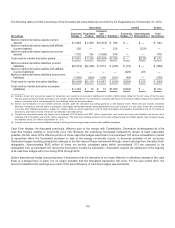
Type of trade
Fair Value at
December 31, 2012 (d)
Valuation
Technique
Unobservable
Input Range
Mark-to-market derivatives—Economic Hedges
(Generation)(a)........................................ $473
Discounted
Cash Flow
Forwardpower
price$14 - $79
Forwardgas
price
Volatility
$3.26 - $6.27
Option Model percentage28% - 132%
Mark-to-market derivatives—Proprietarytrading
(Generation)(a)........................................ $ (6)
Discounted
Cash Flow
Forwardpower
price
Volatility
$15-$106
Option Model percentage16% - 48%
Mark-to-market derivatives—Transactionswithaffiliates
(Generation andComEd) (b) ............................. $226
Discounted
Cash Flow
Marketability
reserve
8% - 9%
Mark-to-market derivatives(ComEd) ........................ $(67) Discounted
Cash Flow
Forwardheat
rate (c) 8% - 9.5%
Marketability
reserve3.5% - 8.3%
Renewable
factor 81%-123%
a)Thevaluation techniques, unobservable inputsandrangesare thesamefor theasset andliabilitypositions.
b) Includescurrent assetsfor Generation andcurrent liabilitiesfor ComEd of$226million,relatedto thefairvalue ofthefive-year financial swap contractbetween
Generation andComEd that endedinMay2013, which eliminatesinconsolidation.
c) Quotedforwardnatural gasratesare utilizedto projecttheforwardpower curvefor thedeliveryofenergy at specifiedfuture dates. The natural gascurveis
extrapolatedbeyonditsobservable periodto theendofthecontract’s delivery.
d) Thefairvaluesdo not includecash collateral heldon Level 3 positionsof$33 million asofDecember 31,2012.
172