ComEd 2013 Annual Report Download - page 219
Download and view the complete annual report
Please find page 219 of the 2013 ComEd annual report below. You can navigate through the pages in the report by either clicking on the pages listed below, or by using the keyword search tool below to find specific information within the annual report.-
 1
1 -
2
-
3
-
4
-
5
-
6
-
7
-
8
-
9
-
10
-
11
-
12
-
13
-
14
-
15
-
16
-
17
-
18
-
19
-
20
-
21
-
22
-
23
-
24
-
25
-
26
-
27
-
28
-
29
-
30
-
31
-
32
-
33
-
34
-
35
-
36
-
37
-
38
-
39
-
40
-
41
-
42
-
43
-
44
-
45
-
46
-
47
-
48
-
49
-
50
-
51
-
52
-
53
-
54
-
55
-
56
-
57
-
58
-
59
-
60
-
61
-
62
-
63
-
64
-
65
-
66
-
67
-
68
-
69
-
70
-
71
-
72
-
73
-
74
-
75
-
76
-
77
-
78
-
79
-
80
-
81
-
82
-
83
-
84
-
85
-
86
-
87
-
88
-
89
-
90
-
91
-
92
-
93
-
94
-
95
-
96
-
97
-
98
-
99
-
100
-
101
-
102
-
103
-
104
-
105
-
106
-
107
-
108
-
109
-
110
-
111
-
112
-
113
-
114
-
115
-
116
-
117
-
118
-
119
-
120
-
121
-
122
-
123
-
124
-
125
-
126
-
127
-
128
-
129
-
130
-
131
-
132
-
133
-
134
-
135
-
136
-
137
-
138
-
139
-
140
-
141
-
142
-
143
-
144
-
145
-
146
-
147
-
148
-
149
-
150
-
151
-
152
-
153
-
154
-
155
-
156
-
157
-
158
-
159
-
160
-
161
-
162
-
163
-
164
-
165
-
166
-
167
-
168
-
169
-
170
-
171
-
172
-
173
-
174
-
175
-
176
-
177
-
178
-
179
-
180
-
181
-
182
-
183
-
184
-
185
-
186
-
187
-
188
-
189
-
190
-
191
-
192
-
193
-
194
-
195
-
196
-
197
-
198
-
199
-
200
-
201
-
202
-
203
-
204
-
205
-
206
-
207
-
208
-
 209
209 -
 210
210 -
 211
211 -
 212
212 -
 213
213 -
 214
214 -
 215
215 -
 216
216 -
 217
217 -
 218
218 -
 219
219 -
 220
220 -
 221
221 -
 222
222 -
 223
223 -
 224
224 -
 225
225 -
 226
226 -
 227
227 -
 228
228 -
 229
229 -
230
-
231
-
232
-
233
-
234
-
235
-
236
-
237
-
238
-
239
-
240
-
241
-
242
-
243
-
244
-
245
-
246
-
247
-
248
-
249
-
250
-
251
-
252
-
253
-
254
-
255
-
256
-
257
-
258
-
259
-
260
 |
 |

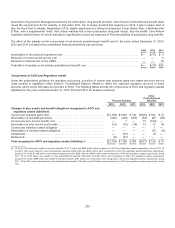
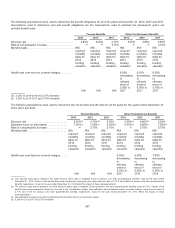
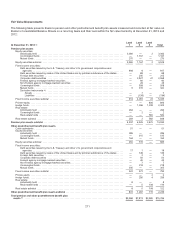
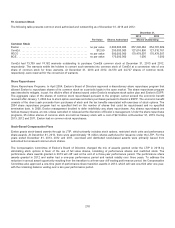
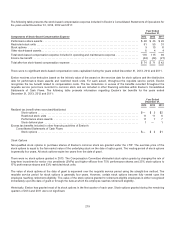
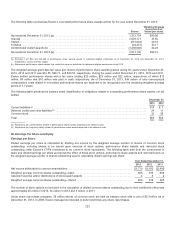
Thefollowingtable presentsthereconciliation ofLevel 3 assetsandliabilitiesmeasuredat fairvalue for pension andother
postretirement benefit plansfor theyearsendedDecember 31,2013 and2012:
Hedge
funds
Private
equity
Real
estate
Debt
securities
Preferred
stock Total
Pension Assets
BalanceasofJanuary1,2013 ................................... $1,235 $ 754 $426$— $— $2,415
Actual return on plan assets:
Relatingto assetsstill heldat the reportingdate ................. 14386 63——292
Relatingto assetssoldduringthe period ....................... 3— (4) — — (1)
Purchases, salesandsettlements:
Purchases ................................................ 360 123 226412752
Sales .................................................... (76) — (91)— — (167)
Settlements(a)............................................. (3)(157) (38) — — (198)
Transfersinto (out of) Level 3 (b) .................................. (623)— — — — (623)
BalanceasofDecember 31,2013 ................................ $1,039$806 $582$41$2$2,470
Other Postretirement Benefits
BalanceasofJanuary1,2013 ................................... $ 12 $1$95 $— $— $ 108
Actual return on plan assets:
Relatingto assetsstill heldat the reportingdate ................. 1—11 —— 12
Relatingto assetssoldduringthe period ....................... — — — — — —
Purchases, salesandsettlements:
Purchases ................................................ — 13—— 4
Sales .................................................... (1)— — — — (1)
Settlements(a)............................................. (4) — — — — (4)
Transfersinto (out of) Level 3 (b) .................................. (4) — — — — (4)
BalanceasofDecember 31,2013 ................................ $ 4 $ 2$109$— $— $115
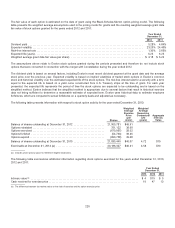
Hedge
funds
Private
equity
Real
estate
Debt
securities
Preferred
stock Total
Pension Assets
BalanceasofJanuary1,2012 ................................... $1,525$672$229$— $— $2,426
Actual return on plan assets:
Relatingto assetsstill heldat the reportingdate ................. 1385524— — 217
Purchases, salesandsettlements:
Purchases ................................................ 447 108134 — — 689
Sales .................................................... (6) — — — — (6)
Settlements(a)............................................. (4) (128) (28) — — (160)
Transfersinto (out of) Level 3 (c)(d)(e)............................... (865) 47 67 — — (751)
BalanceasofDecember 31,2012 ................................ $1,235 $ 754 $426$— $— $2,415
Other Postretirement Benefits
BalanceasofJanuary1,2012 ................................... $ 157 $ 1$ 7 $— $— $ 165
Actual return on plan assets:
Relatingto assetsstill heldat the reportingdate ................. 11 —3—— 14
Purchases, salesandsettlements:
Purchases ................................................ 32 —91——123
Sales .................................................... — — — — — —
Settlements(a)............................................. — — (1)— — (1)
Transfersinto (out of) Level 3 (c)(d)(e)............................... (188) — (5) — — (193)
BalanceasofDecember 31,2012 ................................ $ 12 $1$95 $— $— $ 108
(a)Representscash settlementsonly.
(b) AsofDecember 31,2012,hedgefundinvestmentsthat containedredemption restrictionslimitingExelon’s abilityto redeemtheinvestmentswithin a reasonable
periodoftimewere classifiedasLevel 3 investments. AsofDecember 31,2013,restrictionsfor certaininvestmentsno longer applied, therefore allowingredemption
within a reasonable periodoftimefromthemeasurement date at NAV. Assuch, thesehedgefundinvestmentsare reflectedastransfersout ofLevel 3 to Level 2 of
$627million in 2013.
213