ComEd 2013 Annual Report Download - page 254
Download and view the complete annual report
Please find page 254 of the 2013 ComEd annual report below. You can navigate through the pages in the report by either clicking on the pages listed below, or by using the keyword search tool below to find specific information within the annual report.-
 1
1 -
2
-
3
-
4
-
5
-
6
-
7
-
8
-
9
-
10
-
11
-
12
-
13
-
14
-
15
-
16
-
17
-
18
-
19
-
20
-
21
-
22
-
23
-
24
-
25
-
26
-
27
-
28
-
29
-
30
-
31
-
32
-
33
-
34
-
35
-
36
-
37
-
38
-
39
-
40
-
41
-
42
-
43
-
44
-
45
-
46
-
47
-
48
-
49
-
50
-
51
-
52
-
53
-
54
-
55
-
56
-
57
-
58
-
59
-
60
-
61
-
62
-
63
-
64
-
65
-
66
-
67
-
68
-
69
-
70
-
71
-
72
-
73
-
74
-
75
-
76
-
77
-
78
-
79
-
80
-
81
-
82
-
83
-
84
-
85
-
86
-
87
-
88
-
89
-
90
-
91
-
92
-
93
-
94
-
95
-
96
-
97
-
98
-
99
-
100
-
101
-
102
-
103
-
104
-
105
-
106
-
107
-
108
-
109
-
110
-
111
-
112
-
113
-
114
-
115
-
116
-
117
-
118
-
119
-
120
-
121
-
122
-
123
-
124
-
125
-
126
-
127
-
128
-
129
-
130
-
131
-
132
-
133
-
134
-
135
-
136
-
137
-
138
-
139
-
140
-
141
-
142
-
143
-
144
-
145
-
146
-
147
-
148
-
149
-
150
-
151
-
152
-
153
-
154
-
155
-
156
-
157
-
158
-
159
-
160
-
161
-
162
-
163
-
164
-
165
-
166
-
167
-
168
-
169
-
170
-
171
-
172
-
173
-
174
-
175
-
176
-
177
-
178
-
179
-
180
-
181
-
182
-
183
-
184
-
185
-
186
-
187
-
188
-
189
-
190
-
191
-
192
-
193
-
194
-
195
-
196
-
197
-
198
-
199
-
200
-
201
-
202
-
203
-
204
-
205
-
206
-
207
-
208
-
209
-
210
-
211
-
212
-
213
-
214
-
215
-
216
-
217
-
218
-
219
-
220
-
221
-
222
-
223
-
224
-
225
-
226
-
227
-
228
-
229
-
230
-
231
-
232
-
233
-
234
-
235
-
236
-
237
-
238
-
239
-
240
-
241
-
242
-
243
-
 244
244 -
 245
245 -
 246
246 -
 247
247 -
 248
248 -
 249
249 -
 250
250 -
 251
251 -
 252
252 -
 253
253 -
 254
254 -
 255
255 -
 256
256 -
 257
257 -
 258
258 -
 259
259 -
 260
260
 |
 |

(b) Amountsrepresent activityrecordedat BGE fromMarch 12,2012,theclosingdate ofthemerger,through December 31,2013.
(c) Other primarilyincludesExelon’s corporate operations, sharedservice entitiesandother financingandinvestment activities.
(d) For theyearsendedDecember 31,2013,2012 and2011,utilitytaxesof $79 million,$82million and$27million,respectively, are includedinrevenuesandexpenses
for Generation.For theyearsendedDecember 31,2013,2012 and2011,utilitytaxesof$241million,$239million and$243million,respectively, are includedin
revenuesandexpensesfor ComEd. For theyearsendedDecember 31,2013,2012 and2011,utilitytaxesof$129million,$141million and$173million,respectively,
are includedinrevenuesandexpensesfor PECO. For theyear endedDecember 31,2013 andfor the periodofMarch 12,2012 through December 31,2012,utility
taxesof$82million and $59 million are includedinrevenuesandexpensesfor BGE, respectively.
(e)Intersegment revenuesexcludesalesto unconsolidatedaffiliates. Theintersegment profitassociatedwithGeneration’s sale ofcertain productsandservicesbyand
between Exelon’s segmentsisnot eliminatedinconsolidation due to therecognition ofintersegment profitinaccordancewithregulatoryaccountingguidance.For
Exelon,theseamountsare includedin operatingrevenuesintheConsolidatedStatementsofOperations.
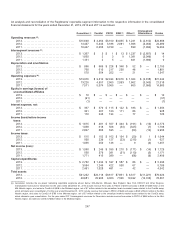
Generation total revenues:
2013 2012 2011
Revenues
from
external
customers (a)
Interseg
ment
revenues
Total
Revenues
Revenues
from
external
customers (a)
Interseg
ment
revenues
Total
Revenues
Revenues
from
external
customers (a)
Interseg
ment
revenues
Total
Revenues
Mid-Atlantic ........ $ 5,182$22 $5,204$5,082$(44) $ 5,038$4,052$— $ 4,052
Midwest........... 4,280(10)4,2704,82424 4,848 5,445 — 5,445
NewEngland ....... 1,245 (8) 1,2371,048 45 1,09311—11
NewYork .......... 735(21)714582(25) 557 — — —
ERCOT............ 1,222 (6) 1,2161,365 21,367 575 — 575
Other Regions(b) .... 946 22 968 755 78 833 201 —201
Total Revenuesfor
Reportable
Segments ........ $13,610 $(1)$13,609$13,656 $ 80$13,736$10,284 $— $10,284
Other (c) ............ 2,020 1 2,021 781(80)701 163—163
Total Generation
Consolidated
Operating
Revenues ........ $15,630 $— $15,630 $14,437$—$14,437$10,447 $— $10,447
(a)Includesall electric salesto thirdpartiesandaffiliatedsalesto ComEd, PECO and BGE.
(b) Other regionsincludetheSouth, WestandCanada, which are not consideredindividually significant.
(c) Other representsactivitiesnot allocatedto a region.See textabovefor a description ofincludedactivities. Alsoincludesamortization ofintangible assetsrelatedto
commoditycontractsrecordedat fairvalue of $767 million and$1,505million for theyearsendedDecember 31,2013 and2012,respectively, andelimination of
intersegment revenues.
Generation total revenues net of purchased power and fuel expense:
2013 2012 2011
RNF from
external
customers (a)
Interseg
ment
RNF
Total
RNF
RNF from
external
customers (a)
Interseg
ment
RNF
Total
RNF
RNF from
external
customers (a)
Interseg
ment
RNF
Total
RNF
Mid-Atlantic ........................... $3,273$(3)$3,270$3,477 $(44) $3,433 $3,350$— $3,350
Midwest.............................. 2,585 12,586 2,974 242,998 3,547 — 3,547
NewEngland.......................... 217(32)185 15145 196 9 — 9
NewYork ............................. 14(18) (4) 101 (25) 76 — — —
ERCOT .............................. 604(168) 436403 2 40584—84
Other Regions(b) ....................... 334(133)201 5378 131 (14) — (14)
Total Revenuesnet ofpurchasedpower and
fuel expensefor Reportable Segments ... $7,027$(353) $6,674 $7,159 $ 80$7,239 $6,976 $— $6,976
Other (c) .............................. 406353759 217(80)137(118) — (118)
Total Generation Revenuesnet of
purchasedpower andfuel expense...... $7,433 $ — $7,433 $7,376 $— $7,376 $6,858 $— $6,858
248