ComEd 2013 Annual Report Download - page 251
Download and view the complete annual report
Please find page 251 of the 2013 ComEd annual report below. You can navigate through the pages in the report by either clicking on the pages listed below, or by using the keyword search tool below to find specific information within the annual report.-
 1
1 -
2
-
3
-
4
-
5
-
6
-
7
-
8
-
9
-
10
-
11
-
12
-
13
-
14
-
15
-
16
-
17
-
18
-
19
-
20
-
21
-
22
-
23
-
24
-
25
-
26
-
27
-
28
-
29
-
30
-
31
-
32
-
33
-
34
-
35
-
36
-
37
-
38
-
39
-
40
-
41
-
42
-
43
-
44
-
45
-
46
-
47
-
48
-
49
-
50
-
51
-
52
-
53
-
54
-
55
-
56
-
57
-
58
-
59
-
60
-
61
-
62
-
63
-
64
-
65
-
66
-
67
-
68
-
69
-
70
-
71
-
72
-
73
-
74
-
75
-
76
-
77
-
78
-
79
-
80
-
81
-
82
-
83
-
84
-
85
-
86
-
87
-
88
-
89
-
90
-
91
-
92
-
93
-
94
-
95
-
96
-
97
-
98
-
99
-
100
-
101
-
102
-
103
-
104
-
105
-
106
-
107
-
108
-
109
-
110
-
111
-
112
-
113
-
114
-
115
-
116
-
117
-
118
-
119
-
120
-
121
-
122
-
123
-
124
-
125
-
126
-
127
-
128
-
129
-
130
-
131
-
132
-
133
-
134
-
135
-
136
-
137
-
138
-
139
-
140
-
141
-
142
-
143
-
144
-
145
-
146
-
147
-
148
-
149
-
150
-
151
-
152
-
153
-
154
-
155
-
156
-
157
-
158
-
159
-
160
-
161
-
162
-
163
-
164
-
165
-
166
-
167
-
168
-
169
-
170
-
171
-
172
-
173
-
174
-
175
-
176
-
177
-
178
-
179
-
180
-
181
-
182
-
183
-
184
-
185
-
186
-
187
-
188
-
189
-
190
-
191
-
192
-
193
-
194
-
195
-
196
-
197
-
198
-
199
-
200
-
201
-
202
-
203
-
204
-
205
-
206
-
207
-
208
-
209
-
210
-
211
-
212
-
213
-
214
-
215
-
216
-
217
-
218
-
219
-
220
-
221
-
222
-
223
-
224
-
225
-
226
-
227
-
228
-
229
-
230
-
231
-
232
-
233
-
234
-
235
-
236
-
237
-
238
-
239
-
240
-
 241
241 -
 242
242 -
 243
243 -
 244
244 -
 245
245 -
 246
246 -
 247
247 -
 248
248 -
 249
249 -
 250
250 -
 251
251 -
 252
252 -
 253
253 -
 254
254 -
 255
255 -
 256
256 -
 257
257 -
 258
258 -
 259
259 -
 260
260
 |
 |

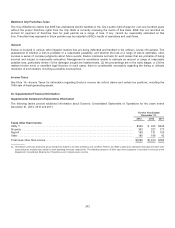
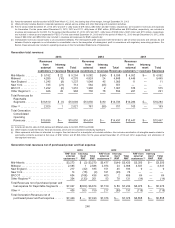
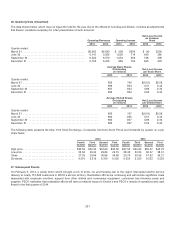
DOE Smart Grid Investment Grant. For theyear endedDecember 31,2013,Exelon, PECO and BGE haveincludedinthecapital
expendituresline itemunder investingactivitiesofthecash flowstatement capital expendituresof $74 million,$27million and
$47 million,respectively, andreimbursementsof $95 million,$37million and $58 million,respectively, relatedto PECO’s and BGE’s
DOE SGIG programs. For theyear endedDecember 31,2012,Exelon, PECO and BGE haveincludedinthecapital expenditures
line itemunder investingactivitiesofthecash flowstatement capital expendituresof$103 million, $56 million and $47 million,
respectively, andreimbursementsof$113 million, $66 million and $47 million,respectively, relatedto PECO’s and BGE’s DOE SGIG
programs. See Note 3—RegulatoryMattersfor additional information regardingtheDOE SGIG.
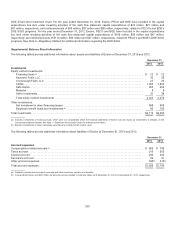
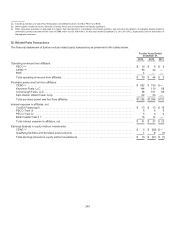
Supplemental Balance Sheet Information
Thefollowingtablesprovideadditional information about assetsandliabilitiesofExelon at December 31,2013 and2012.
December 31,
2013 2012
Investments
Equitymethodinvestments:
Financingtrusts(a)............................................................................ $ 22 $22
Keystone Fuels,LLC.......................................................................... 32 38
Conemaugh Fuels,LLC ....................................................................... 21 26
CENG ...................................................................................... 1,9251,849
SafeHarbor ................................................................................. 285 293
Malacha.................................................................................... 8 8
Other investments............................................................................ 31 34
Total equitymethodinvestments ................................................................ 2,3242,270
Other investments:
Net investment indirectfinancingleases ......................................................... 698 685
Employee benefit trustsandinvestments(b) ....................................................... 90 100
Total investments ................................................................................ $3,112 $3,055
(a)Includesinvestmentsinfinancingtrusts, which were not consolidatedwithinthefinancial statementsofExelon andare shownasinvestmentsinaffiliateson the
ConsolidatedBalanceSheets. See Note 1—Significant AccountingPoliciesfor additional information.
(b) Exelon’s investmentsinthesemarketable securitiesare recordedat fairmarket value.
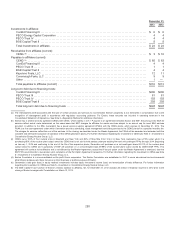
Thefollowingtablesprovideadditional information about liabilitiesofExelon at December 31,2013 and2012.
December 31,
2013 2012
Accrued expenses
Compensation-relatedaccruals(a)................................................................... $ 683$708
Taxesaccrued .................................................................................. 315353
Interestaccrued ................................................................................. 234232
Severanceaccrued............................................................................... 66 91
Other accruedexpenses .......................................................................... 335(b) 412(b)
Total accruedexpenses ........................................................................... $1,633 $1,796
(a)Primarilyincludesaccruedpayroll,bonusesandother incentives, vacation andbenefits.
(b) Includes$228million and$327million for amountsaccruedrelatedto Antelope ValleyasofDecember 31,2013 andDecember 31,2012,respectively.
245