ComEd 2013 Annual Report Download - page 86
Download and view the complete annual report
Please find page 86 of the 2013 ComEd annual report below. You can navigate through the pages in the report by either clicking on the pages listed below, or by using the keyword search tool below to find specific information within the annual report.-
 1
1 -
2
-
3
-
4
-
5
-
6
-
7
-
8
-
9
-
10
-
11
-
12
-
13
-
14
-
15
-
16
-
17
-
18
-
19
-
20
-
21
-
22
-
23
-
24
-
25
-
26
-
27
-
28
-
29
-
30
-
31
-
32
-
33
-
34
-
35
-
36
-
37
-
38
-
39
-
40
-
41
-
42
-
43
-
44
-
45
-
46
-
47
-
48
-
49
-
50
-
51
-
52
-
53
-
54
-
55
-
56
-
57
-
58
-
59
-
60
-
61
-
62
-
63
-
64
-
65
-
66
-
67
-
68
-
69
-
70
-
71
-
72
-
73
-
74
-
75
-
 76
76 -
 77
77 -
 78
78 -
 79
79 -
 80
80 -
 81
81 -
 82
82 -
 83
83 -
 84
84 -
 85
85 -
 86
86 -
 87
87 -
 88
88 -
 89
89 -
 90
90 -
 91
91 -
 92
92 -
 93
93 -
 94
94 -
 95
95 -
 96
96 -
97
-
98
-
99
-
100
-
101
-
102
-
103
-
104
-
105
-
106
-
107
-
108
-
109
-
110
-
111
-
112
-
113
-
114
-
115
-
116
-
117
-
118
-
119
-
120
-
121
-
122
-
123
-
124
-
125
-
126
-
127
-
128
-
129
-
130
-
131
-
132
-
133
-
134
-
135
-
136
-
137
-
138
-
139
-
140
-
141
-
142
-
143
-
144
-
145
-
146
-
147
-
148
-
149
-
150
-
151
-
152
-
153
-
154
-
155
-
156
-
157
-
158
-
159
-
160
-
161
-
162
-
163
-
164
-
165
-
166
-
167
-
168
-
169
-
170
-
171
-
172
-
173
-
174
-
175
-
176
-
177
-
178
-
179
-
180
-
181
-
182
-
183
-
184
-
185
-
186
-
187
-
188
-
189
-
190
-
191
-
192
-
193
-
194
-
195
-
196
-
197
-
198
-
199
-
200
-
201
-
202
-
203
-
204
-
205
-
206
-
207
-
208
-
209
-
210
-
211
-
212
-
213
-
214
-
215
-
216
-
217
-
218
-
219
-
220
-
221
-
222
-
223
-
224
-
225
-
226
-
227
-
228
-
229
-
230
-
231
-
232
-
233
-
234
-
235
-
236
-
237
-
238
-
239
-
240
-
241
-
242
-
243
-
244
-
245
-
246
-
247
-
248
-
249
-
250
-
251
-
252
-
253
-
254
-
255
-
256
-
257
-
258
-
259
-
260
 |
 |

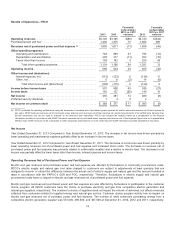
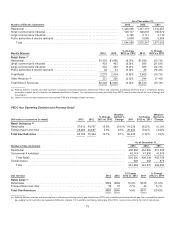
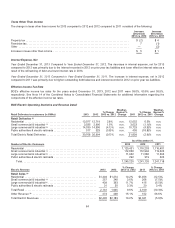
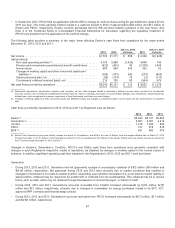
Results of Operations—BGE
2013 2012
Favorable
(unfavorable)
2013 vs. 2012
variance 2011
Favorable
(unfavorable)
2012 vs. 2011
variance
Operating revenues ........................................... $3,065 $2,735$330 $3,068 $(333)
Purchasedpower andfuel expense................................ 1,421 1,369 (52)1,593224
Revenue net of purchased power and fuel expense (a) .............. 1,644 1,366 278 1,475 (109)
Other operating expenses
Operatingandmaintenance.................................. 63472894680(48)
Depreciation andamortization ................................ 348 298 (50)274 (24)
Taxesother than income..................................... 213 208 (5) 207(1)
Total other operatingexpenses............................ 1,195 1,234391,161(73)
Operating income ............................................. 449 132 317314(182)
Other income and (deductions)
Interestexpense,net ........................................ (122)(144) 22 (129) (15)
Other,net ................................................. 1723 (6) 26(3)
Total other incomeand(deductions) ....................... (105) (121)16(103)(18)
Income before income taxes .................................... 344 11 333 211 (200)
Income taxes ................................................. 1347(127) 75 68
Net income ................................................... 210 4206136(132)
Preferencestock dividends....................................... 13 13 —13 —
Net income (loss) attributable to common shareholder ............. $ 197 $ (9) $ 206$123 $(132)
(a) BGE evaluatesitsoperatingperformanceusingthemeasuresofrevenuesnet ofpurchasedpower expensefor electric salesandrevenuesnet offuel expensefor
gassales. BGE believesrevenuesnet ofpurchasedpower andfuel expense are useful measurementsofitsperformancebecausetheyprovideinformation that can
beusedto evaluate itsnet revenuesfromoperations. BGE hasincludedthe analysis belowasacomplement to thefinancial information providedinaccordancewith
GAAP. However,revenuesnet ofpurchasedpower andfuel expensefiguresare not a presentation definedunder GAAPandmaynot becomparable to other
companies’ presentationsor more useful than theGAAPinformation providedelsewhere inthis report.
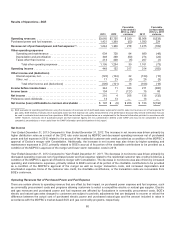
Net Income
Year Ended December 31, 2013 Compared to Year Ended December 31, 2012. Theincreasein net incomewasdriven primarilyby
higher distribution ratesasaresult ofthe 2012 rate order issued by MDPSC anddecreasedoperatingrevenuesnet ofpurchased
power andfuel expensein 2012 relatedto theaccrual oftheresidential customer rate credit providedasacondition oftheMDPSC’s
approval ofExelon’s merger withConstellation.Additionally, theincreasein net incomewasalsodriven by higher operatingand
maintenanceexpensesin 2012,primarilyrelatedto BGE’s accrual ofitsportion ofthecharitable contributionsto be providedasa
condition oftheMDPSC’s approval ofthemerger andlower stormrestoration costsin 2013.
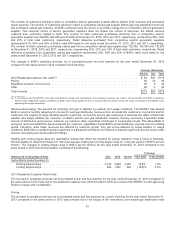
Year Ended December 31, 2012 Compared to Year Ended December 31, 2011. Thedecreasein net incomewasdriven primarilyby
decreasedoperatingrevenuesnet ofpurchasedpower andfuel expense relatedto theresidential customer rate credit providedasa
condition oftheMDPSC’s approval ofExelon’s merger withConstellation.Thedecreasein net incomewasalsodriven by increased
operatingandmaintenanceexpenses, primarilyrelatedto BGE’s accrual ofitsportion ofthecharitable contributionsto be provided
asacondition oftheMDPSC’s approval ofthemerger aswell asmerger transaction costs, andincreaseddepreciation and
amortization expense.None ofthecustomer rate credit,thecharitable contributions, or the transaction costsare recoverable from
BGE’s customers.
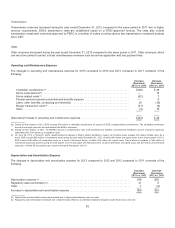
Operating Revenues Net of Purchased Power and Fuel Expense
There are certaindriversto operatingrevenue that are offset by theirimpact on purchasedpower expenseandfuel expense,such
ascommodityprocurement costsandprograms allowingcustomersto selectacompetitive electric or natural gassupplier.Electric
andgasrevenuesandpurchasedpower andfuel expense are affectedbyfluctuationsincommodityprocurement costs. BGE’s
electric andnatural gasrateschargedto customersare subject to periodic adjustmentsthat are designedto recover or refundthe
differencebetween theactual costofpurchasedelectric power andpurchasednatural gasandtheamount includedin ratesin
accordancewiththeMDPSC’s market-based SOS andgascommodityprograms, respectively.
80