ComEd 2013 Annual Report Download - page 82
Download and view the complete annual report
Please find page 82 of the 2013 ComEd annual report below. You can navigate through the pages in the report by either clicking on the pages listed below, or by using the keyword search tool below to find specific information within the annual report.-
 1
1 -
2
-
3
-
4
-
5
-
6
-
7
-
8
-
9
-
10
-
11
-
12
-
13
-
14
-
15
-
16
-
17
-
18
-
19
-
20
-
21
-
22
-
23
-
24
-
25
-
26
-
27
-
28
-
29
-
30
-
31
-
32
-
33
-
34
-
35
-
36
-
37
-
38
-
39
-
40
-
41
-
42
-
43
-
44
-
45
-
46
-
47
-
48
-
49
-
50
-
51
-
52
-
53
-
54
-
55
-
56
-
57
-
58
-
59
-
60
-
61
-
62
-
63
-
64
-
65
-
66
-
67
-
68
-
69
-
70
-
71
-
 72
72 -
 73
73 -
 74
74 -
 75
75 -
 76
76 -
 77
77 -
 78
78 -
 79
79 -
 80
80 -
 81
81 -
 82
82 -
 83
83 -
 84
84 -
 85
85 -
 86
86 -
 87
87 -
 88
88 -
 89
89 -
 90
90 -
 91
91 -
 92
92 -
93
-
94
-
95
-
96
-
97
-
98
-
99
-
100
-
101
-
102
-
103
-
104
-
105
-
106
-
107
-
108
-
109
-
110
-
111
-
112
-
113
-
114
-
115
-
116
-
117
-
118
-
119
-
120
-
121
-
122
-
123
-
124
-
125
-
126
-
127
-
128
-
129
-
130
-
131
-
132
-
133
-
134
-
135
-
136
-
137
-
138
-
139
-
140
-
141
-
142
-
143
-
144
-
145
-
146
-
147
-
148
-
149
-
150
-
151
-
152
-
153
-
154
-
155
-
156
-
157
-
158
-
159
-
160
-
161
-
162
-
163
-
164
-
165
-
166
-
167
-
168
-
169
-
170
-
171
-
172
-
173
-
174
-
175
-
176
-
177
-
178
-
179
-
180
-
181
-
182
-
183
-
184
-
185
-
186
-
187
-
188
-
189
-
190
-
191
-
192
-
193
-
194
-
195
-
196
-
197
-
198
-
199
-
200
-
201
-
202
-
203
-
204
-
205
-
206
-
207
-
208
-
209
-
210
-
211
-
212
-
213
-
214
-
215
-
216
-
217
-
218
-
219
-
220
-
221
-
222
-
223
-
224
-
225
-
226
-
227
-
228
-
229
-
230
-
231
-
232
-
233
-
234
-
235
-
236
-
237
-
238
-
239
-
240
-
241
-
242
-
243
-
244
-
245
-
246
-
247
-
248
-
249
-
250
-
251
-
252
-
253
-
254
-
255
-
256
-
257
-
258
-
259
-
260
 |
 |

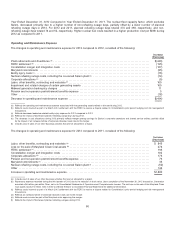
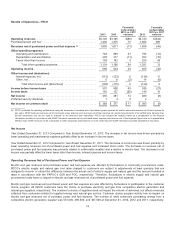
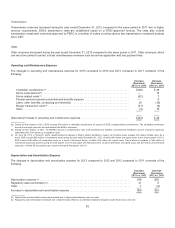
operatingandmaintenanceexpense,depreciation andamortization expenseandincometaxes. Refer to the operatingand
maintenanceexpensediscussion belowfor additional information on includedprograms.
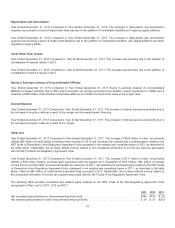
Gross Receipts Tax
GRTisan excisetaxon total electric revenues. Asaresult ofdecreasesin operatingrevenuescomparedto 2012,GRTdecreased.
Equal andoffsettingdecreasesinGRThavebeen reflectedintaxesother than income.
Gas Distribution Tax Repair
Thedecreaseingas distribution taxrepairreflectsthe 2012 taxbenefitreceivedfromprior periodgas distribution repairsfor the
2011 taxyear.There is an equal andoffsettingtaxbenefitin operatingrevenues, see Note 3—RegulatoryMattersfor further
explanation.
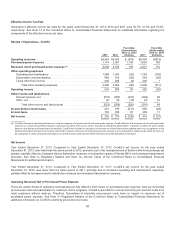
Other
Thedecreaseinother electric revenuesnet ofpurchasedpower expensecomparedto theyear endedDecember 31,2012 reflectsa
decreaseinwholesale transmission revenuesearned by PECO due to higher peakloads inthe previousyears.
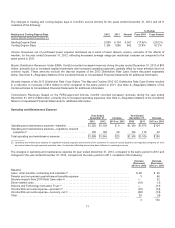
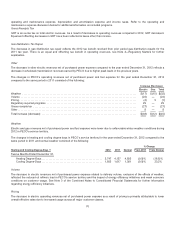
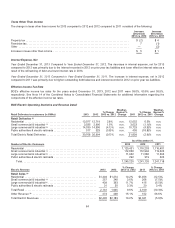
ThechangesinPECO’s operatingrevenuesnet ofpurchasedpower andfuel expensefor theyear endedDecember 31,2012
comparedto thesame periodin 2011 consistedofthefollowing:
Increase (Decrease)
Electric Gas Total
Weather ................................................................................... $(17) $(15) $(32)
Volume.................................................................................... (22)— (22)
Pricing..................................................................................... (4) 3(1)
Regulatoryrequiredprograms ................................................................. 29— 29
Gross receiptstax ........................................................................... (27) — (27)
Other ...................................................................................... 8 — 8
Total increase(decrease) ..................................................................... $(33)$(12) $(45)
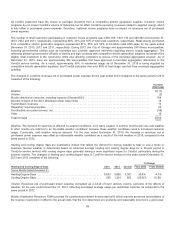
Weather
Electric andgasrevenuesnet ofpurchasedpower andfuel expensewere lower due to unfavorable winter weather conditionsduring
2012 inPECO’s service territory.
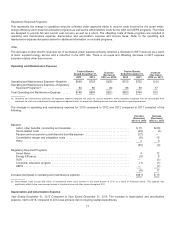
Thechangesinheatingandcoolingdegree days inPECO’s service territoryfor theyear endedDecember 31,2012 comparedto the
same periodin 2011 andnormal weather consistedofthefollowing:
% Change
Heating and Cooling Degree-Days (a) 2012 2011 Normal From 2011 From Normal
TwelveMonths EndedDecember 31,
HeatingDegree-Days............................................ 3,747 4,157 4,603 (9.9)% (18.6)%
CoolingDegree-Days............................................ 1,603 1,6171,301 (0.9)% 23.2%
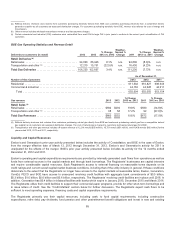
Volume
Thedecreasein electric revenuesnet ofpurchasedpower expense relatedto deliveryvolume,exclusiveoftheeffectsofweather,
reflectedthereducedoilrefineryloadinPECO’s service territoryandtheimpactofenergy efficiency initiativesandweakeconomic
conditionson customer usage.See Note 3 oftheCombinedNotesto ConsolidatedFinancial Statementsfor further information
regardingenergy efficiency initiatives.
Pricing
Thedecreasein electric operatingrevenuesnet ofpurchasedpower expenseasaresult ofpricingisprimarilyattributable to lower
overall effective ratesdue to increasedusageacross all major customer classes.
76