ComEd 2013 Annual Report Download - page 73
Download and view the complete annual report
Please find page 73 of the 2013 ComEd annual report below. You can navigate through the pages in the report by either clicking on the pages listed below, or by using the keyword search tool below to find specific information within the annual report.-
 1
1 -
2
-
3
-
4
-
5
-
6
-
7
-
8
-
9
-
10
-
11
-
12
-
13
-
14
-
15
-
16
-
17
-
18
-
19
-
20
-
21
-
22
-
23
-
24
-
25
-
26
-
27
-
28
-
29
-
30
-
31
-
32
-
33
-
34
-
35
-
36
-
37
-
38
-
39
-
40
-
41
-
42
-
43
-
44
-
45
-
46
-
47
-
48
-
49
-
50
-
51
-
52
-
53
-
54
-
55
-
56
-
57
-
58
-
59
-
60
-
61
-
62
-
 63
63 -
 64
64 -
 65
65 -
 66
66 -
 67
67 -
 68
68 -
 69
69 -
 70
70 -
 71
71 -
 72
72 -
 73
73 -
 74
74 -
 75
75 -
 76
76 -
 77
77 -
 78
78 -
 79
79 -
 80
80 -
 81
81 -
 82
82 -
 83
83 -
84
-
85
-
86
-
87
-
88
-
89
-
90
-
91
-
92
-
93
-
94
-
95
-
96
-
97
-
98
-
99
-
100
-
101
-
102
-
103
-
104
-
105
-
106
-
107
-
108
-
109
-
110
-
111
-
112
-
113
-
114
-
115
-
116
-
117
-
118
-
119
-
120
-
121
-
122
-
123
-
124
-
125
-
126
-
127
-
128
-
129
-
130
-
131
-
132
-
133
-
134
-
135
-
136
-
137
-
138
-
139
-
140
-
141
-
142
-
143
-
144
-
145
-
146
-
147
-
148
-
149
-
150
-
151
-
152
-
153
-
154
-
155
-
156
-
157
-
158
-
159
-
160
-
161
-
162
-
163
-
164
-
165
-
166
-
167
-
168
-
169
-
170
-
171
-
172
-
173
-
174
-
175
-
176
-
177
-
178
-
179
-
180
-
181
-
182
-
183
-
184
-
185
-
186
-
187
-
188
-
189
-
190
-
191
-
192
-
193
-
194
-
195
-
196
-
197
-
198
-
199
-
200
-
201
-
202
-
203
-
204
-
205
-
206
-
207
-
208
-
209
-
210
-
211
-
212
-
213
-
214
-
215
-
216
-
217
-
218
-
219
-
220
-
221
-
222
-
223
-
224
-
225
-
226
-
227
-
228
-
229
-
230
-
231
-
232
-
233
-
234
-
235
-
236
-
237
-
238
-
239
-
240
-
241
-
242
-
243
-
244
-
245
-
246
-
247
-
248
-
249
-
250
-
251
-
252
-
253
-
254
-
255
-
256
-
257
-
258
-
259
-
260
 |
 |

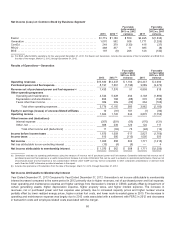
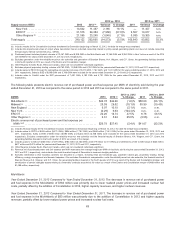
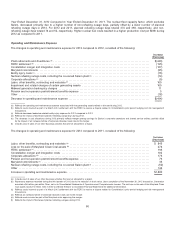
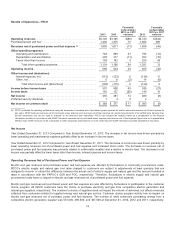
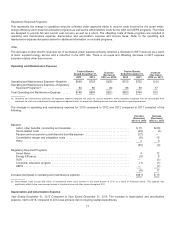
Depreciation and Amortization
Year Ended December 31, 2013 Compared to Year Ended December 31, 2012.Theincreaseindepreciation andamortization
expensewasprimarilyaresult of higher plant balancesdue to theaddition ofConstellation facilitiesandongoingcapital additions.
Year Ended December 31, 2012 Compared to Year Ended December 31, 2011.Theincreaseindepreciation andamortization
expensewasprimarilyaresult of higher plant balancesdue to theaddition ofConstellation facilities; andcapital additionsandother
upgradesto legacy plants.
Taxes Other Than Income
Year Ended December 31, 2013 Compared to Year Ended December 31, 2012.Theincreasewasprimarilydue to theaddition of
Constellation’s financial resultsin 2012.
Year Ended December 31, 2012 Compared to Year Ended December 31, 2011.Theincreasewasprimarilydue to theaddition of
Constellation’s financial resultsin 2012.
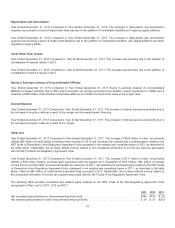
Equity in Earnings (Losses) of Unconsolidated Affiliates
Year Ended December 31, 2013 Compared to Year Ended December 31, 2012.Equityin earnings (losses) ofunconsolidated
affiliatesincreasedprimarilydue to $50million favorable net incomegeneratedfromExelon’s equityinvestment inCENG anda
reduction of $58 million ofamortization ofthebasis differenceinCENG recordedat fairvalue at themerger date.
Interest Expense
Year Ended December 31, 2013 Compared to Year Ended December 31, 2012.Theincreaseininterestexpenseis primarilydue to
theincreasein long-termdebtasaresult ofthemerger andincreasedprojectfinancing.
Year Ended December 31, 2012 Compared to Year Ended December 31, 2011.Theincreaseininterestexpenseis primarilydue to
theincreasein long-termdebtasaresult ofthemerger.
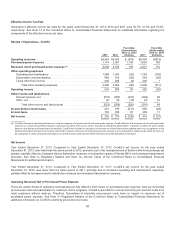
Other, Net
Year Ended December 31, 2013 Compared to Year Ended December 31, 2012.Theincreaseof$129million inother,net primarily
reflects $85 million ofcreditfacilitytermination feesrecordedin 2012 andincreasednet realizedandunrealizedgainsrelatedto the
NDT funds ofGeneration’s Non-RegulatoryAgreement Unitscomparedto net realizedandunrealizedgainsin 2012,asdescribedin
thetable below. Additionally, theincreasereflectsincome relatedto thecontractual elimination ofincometaxexpenseassociated
withtheNDT funds oftheRegulatoryAgreement Units.
Year Ended December 31, 2012 Compared to Year Ended December 31, 2011.Theincreaseof$117million inother,net primarily
reflectsa$36million bargain purchasegainassociatedwiththeAugust 2011 acquisition ofWolfHollow, $32 million ofinterest
incomefroma one-timeNDT fundspecial transfer taxdeduction in 2011,net realizedandunrealizedgainsrelatedto theNDT funds
ofGeneration’s Non-RegulatoryAgreement Unitscomparedto net realizedandunrealizedlossesin 2011,asdescribedinthetable
below, offset by $85 million ofcreditfacilitytermination feesrecordedin 2012.Additionally, theincreasereflectsincome relatedto
thecontractual elimination ofincometaxexpenseassociatedwiththeNDT funds oftheRegulatoryAgreement Units.
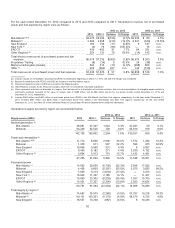
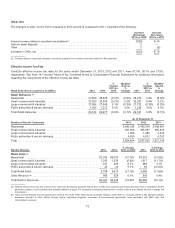
Thefollowingtable providesunrealizedandrealizedgains(losses) on theNDT funds oftheNon-RegulatoryAgreement Units
recognizedinOther,net for 2013,2012 and2011:
2013 2012 2011
Net unrealizedgains(losses) on decommissioningtrustfunds ........................................ $146 $105 $ (4)
Net realizedgains(losses) on sale ofdecommissioningtrustfunds .................................... $ 24$51$(10)
67