ComEd 2013 Annual Report Download - page 253
Download and view the complete annual report
Please find page 253 of the 2013 ComEd annual report below. You can navigate through the pages in the report by either clicking on the pages listed below, or by using the keyword search tool below to find specific information within the annual report.-
 1
1 -
2
-
3
-
4
-
5
-
6
-
7
-
8
-
9
-
10
-
11
-
12
-
13
-
14
-
15
-
16
-
17
-
18
-
19
-
20
-
21
-
22
-
23
-
24
-
25
-
26
-
27
-
28
-
29
-
30
-
31
-
32
-
33
-
34
-
35
-
36
-
37
-
38
-
39
-
40
-
41
-
42
-
43
-
44
-
45
-
46
-
47
-
48
-
49
-
50
-
51
-
52
-
53
-
54
-
55
-
56
-
57
-
58
-
59
-
60
-
61
-
62
-
63
-
64
-
65
-
66
-
67
-
68
-
69
-
70
-
71
-
72
-
73
-
74
-
75
-
76
-
77
-
78
-
79
-
80
-
81
-
82
-
83
-
84
-
85
-
86
-
87
-
88
-
89
-
90
-
91
-
92
-
93
-
94
-
95
-
96
-
97
-
98
-
99
-
100
-
101
-
102
-
103
-
104
-
105
-
106
-
107
-
108
-
109
-
110
-
111
-
112
-
113
-
114
-
115
-
116
-
117
-
118
-
119
-
120
-
121
-
122
-
123
-
124
-
125
-
126
-
127
-
128
-
129
-
130
-
131
-
132
-
133
-
134
-
135
-
136
-
137
-
138
-
139
-
140
-
141
-
142
-
143
-
144
-
145
-
146
-
147
-
148
-
149
-
150
-
151
-
152
-
153
-
154
-
155
-
156
-
157
-
158
-
159
-
160
-
161
-
162
-
163
-
164
-
165
-
166
-
167
-
168
-
169
-
170
-
171
-
172
-
173
-
174
-
175
-
176
-
177
-
178
-
179
-
180
-
181
-
182
-
183
-
184
-
185
-
186
-
187
-
188
-
189
-
190
-
191
-
192
-
193
-
194
-
195
-
196
-
197
-
198
-
199
-
200
-
201
-
202
-
203
-
204
-
205
-
206
-
207
-
208
-
209
-
210
-
211
-
212
-
213
-
214
-
215
-
216
-
217
-
218
-
219
-
220
-
221
-
222
-
223
-
224
-
225
-
226
-
227
-
228
-
229
-
230
-
231
-
232
-
233
-
234
-
235
-
236
-
237
-
238
-
239
-
240
-
241
-
242
-
 243
243 -
 244
244 -
 245
245 -
 246
246 -
 247
247 -
 248
248 -
 249
249 -
 250
250 -
 251
251 -
 252
252 -
 253
253 -
 254
254 -
 255
255 -
 256
256 -
 257
257 -
 258
258 -
 259
259 -
 260
260
 |
 |

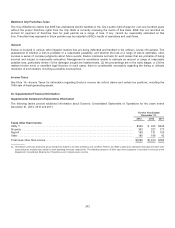
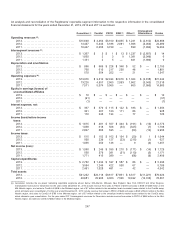
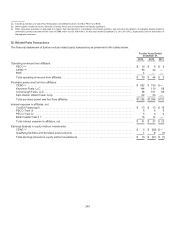
An analysis andreconciliation oftheRegistrants’ reportable segment information to therespectiveinformation intheconsolidated
financial statementsfor theyearsendedDecember 31,2013,2012 and2011 is asfollows:
Generation (a) ComEd PECO BGE (b) Other (c)
Intersegment
Eliminations Exelon
Operating revenues (d):
2013 ...................................... $15,630 $ 4,464 $3,100 $3,065 $ 1,241$(2,612)$24,888
2012 ...................................... 14,437 5,4433,186 2,0911,396 (3,064) 23,489
2011 ...................................... 10,447 6,056 3,720 —830 (1,990)19,063
Intersegment revenues (e):
2013 ...................................... $ 1,367 $ 3$1$13 $1,237$(2,607) $ 14
2012 ...................................... 1,6602391,381(3,049) 6
2011 ...................................... 1,16125— 831 (1,990)9
Depreciation and amortization
2013 ...................................... $ 856 $ 669 $ 228$348 $ 52$— $2,153
2012 ...................................... 768 610 21723848 —1,881
2011 ...................................... 570554 202 —21 —1,347
Operating expenses (d):
2013 ...................................... $13,976 $ 3,510 $2,434$2,616$1,324$(2,618) $21,242
2012 ...................................... 13,226 4,557 2,5632,0531,662(3,043)21,018
2011 ...................................... 7,5715,074 3,065 — 863(1,990)14,583
Equity in earnings (losses) of
unconsolidated affiliates
2013 ...................................... $ 10 $ — $— $— $ — $ — $ 10
2012 ...................................... (91) ——— — — (91)
2011 ...................................... (1) ——— — — (1)
Interest expense, net:
2013 ...................................... $ 357 $ 579 $ 115$122 $183$— $1,356
2012 ...................................... 301 307123 111 86 — 928
2011 ...................................... 170345 134— 77 — 726
Income (loss) before income
taxes:
2013 ...................................... $ 1,675 $ 401 $ 557 $ 344 $ (191)$ (13)$2,773
2012 ...................................... 1,058 618508 (54) (325) (7) 1,798
2011 ...................................... 2,827 666 535 — (59) (13)3,956
Income taxes:
2013 ...................................... $ 615$152$162$134$ (20)$ 1$1,044
2012 ...................................... 500 239127(23)(215) (1)627
2011 ...................................... 1,056 250146 — 9 (4) 1,457
Net income (loss):
2013 ...................................... $ 1,060$249 $ 395 $ 210 $(171)$ (14) $ 1,729
2012 ...................................... 558 379 381(31)(110) (6) 1,171
2011 ...................................... 1,771416389 — (68) (9) 2,499
Capital expenditures:
2013 ...................................... $ 2,752$1,433 $537 $ 587 $ 86 $ — $ 5,395
2012 ...................................... 3,554 1,246 422 500 67 — 5,789
2011 ...................................... 2,4911,028481—42—4,042
Total assets:
2013 ...................................... $41,232 $24,118 $9,617 $7,861$8,317$(11,221) $79,924
2012 ...................................... 40,68122,9059,3537,50610,432 (12,316) 78,561
(a)Generation includesthesix power marketingreportable segmentsshownbelow: Mid-Atlantic, Midwest,NewEngland, NewYork, ERCOT andOther Regions.
Intersegment revenuesfor Generation for theyear endedDecember 31,2013 includerevenue fromsalesto PECO of$405andsalesto BGE of $455 million inthe
Mid-Atlantic region,andsalesto ComEd of$506intheMidwestregion,net of$7million relatedto the unrealizedmark-to-market lossesrelatedto theComEd swap,
which eliminate upon consolidation.For theyear endedDecember 31,2012 includerevenue fromsalesto PECO of $543andsalesto BGE of$322 million intheMid-
Atlantic region,andsalesto ComEd of $795 intheMidwestregion,net of$7million relatedto the unrealizedmark-to-market lossesrelatedto theComEd swap,
which eliminate upon consolidation.For theyear ended2011 intersegment revenuesfor Generation includerevenue fromsalesto PECO of$508million intheMid-
Atlantic region,andsalesto ComEd of $653million intheMidwestregion.
247