Xerox 2011 Annual Report Download - page 95
Download and view the complete annual report
Please find page 95 of the 2011 Xerox annual report below. You can navigate through the pages in the report by either clicking on the pages listed below, or by using the keyword search tool below to find specific information within the annual report.-
 1
1 -
2
-
3
-
4
-
5
-
6
-
7
-
8
-
9
-
10
-
11
-
12
-
13
-
14
-
15
-
16
-
17
-
18
-
19
-
20
-
21
-
22
-
23
-
24
-
25
-
26
-
27
-
28
-
29
-
30
-
31
-
32
-
33
-
34
-
35
-
36
-
37
-
38
-
39
-
40
-
41
-
42
-
43
-
44
-
45
-
46
-
47
-
48
-
49
-
50
-
51
-
52
-
53
-
54
-
55
-
56
-
57
-
58
-
59
-
60
-
61
-
62
-
63
-
64
-
65
-
66
-
67
-
68
-
69
-
70
-
71
-
72
-
73
-
74
-
75
-
76
-
77
-
78
-
79
-
80
-
81
-
82
-
83
-
84
-
 85
85 -
 86
86 -
 87
87 -
 88
88 -
 89
89 -
 90
90 -
 91
91 -
 92
92 -
 93
93 -
 94
94 -
 95
95 -
 96
96 -
 97
97 -
 98
98 -
 99
99 -
 100
100 -
 101
101 -
 102
102 -
 103
103 -
 104
104 -
 105
105 -
106
-
107
-
108
-
109
-
110
-
111
-
112
-
113
-
114
-
115
-
116
 |
 |

93Xerox 2011 Annual Report
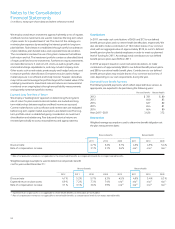
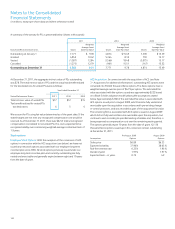
A reconciliation of the U.S. federal statutory income tax rate to the
consolidated effective income tax rate was as follows:
Year Ended December 31,
2011 2010 2009
U.S. federal statutory income
tax rate 35.0% 35.0% 35.0%
Nondeductible expenses 2.0% 6.3% 3.2%
Effect of tax law changes 0.2% (0.2)% —%
Change in valuation allowance
for deferred tax assets (0.3)% 2.6% (1.7)%
State taxes, net of federal benefit 2.4% 2.0% (0.2)%
Audit and other tax return
adjustments (1.0)% (3.6)% (8.7)%
Tax-exempt income, credits
and incentives (3.1)% (3.9)% (4.7)%
Foreign rate differential
adjusted for U.S. taxation
of foreign profits(1) (10.4)% (6.7)% 0.5%
Other (0.1)% (0.1)% 0.8%
Effective Income Tax Rate
24.7% 31.4% 24.2%
(1) The “U.S. taxation of foreign profits” represents the U.S. tax, net of foreign tax credits,
associated with actual and deemed repatriations of earnings from our non-U.S.
subsidiaries.
On a consolidated basis, we paid a total of $94, $49 and $78 in income
taxes to federal, foreign and state jurisdictions during the three years
ended December 31, 2011, 2010 and 2009, respectively.
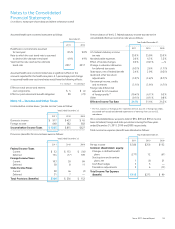
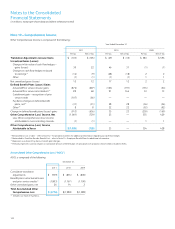
Total income tax expense (benefit) was allocated as follows:
Year Ended December 31,
2011 2010 2009
Pre-tax income $ 386 $ 256 $ 152
Common shareholders’ equity:
Changes in defined benefit
plans (277) 12 (61)
Stock option and incentive
plans, net 1 (6) 21
Cash flow hedges 3 5 —
Translation adjustments 2 6 (13)
Total Income Tax Expense
(Benefit) $ 115 $ 273 $ 99
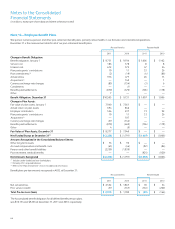
Assumed healthcare cost trend rates were as follows:
December 31,
2011 2010
Healthcare cost trend rate assumed
for next year 8.5% 9.0%
Rate to which the cost trend rate is assumed
to decline (the ultimate trend rate) 4.9% 4.9%
Year that the rate reaches the ultimate
trend rate 2017 2017
Assumed healthcare cost trend rates have a significant effect on the
amounts reported for the healthcare plans. A 1-percentage point change
in assumed healthcare cost trend rates would have the following effects:
1% increase 1% decrease
Effect on total service and interest
cost components $ 5 $ (4)
Effect on post-retirement benefit obligation 89 (72)
Note 15 – Income and Other Taxes
Income before income taxes (“pre-tax income”) was as follows:
Year Ended December 31,
2011 2010 2009
Domestic income $ 917 $ 433 $ 45
Foreign income 648 382 582
Income before Income Taxes $ 1,565 $ 815 $ 627
Provisions (benefits) for income taxes were as follows:
Year Ended December 31,
2011 2010 2009
Federal Income Taxes
Current $ 52 $ 153 $ (50)
Deferred 134 (17) 109
Foreign Income Taxes
Current 103 59 84
Deferred 38 8 11
State Income Taxes
Current 28 46 (2)
Deferred 31 7 —
Total Provisions (Benefits) $ 386 $ 256 $ 152
Notes to the Consolidated
Financial Statements
(in millions, except per-share data and where otherwise noted)