Xerox 2011 Annual Report Download - page 43
Download and view the complete annual report
Please find page 43 of the 2011 Xerox annual report below. You can navigate through the pages in the report by either clicking on the pages listed below, or by using the keyword search tool below to find specific information within the annual report.-
 1
1 -
2
-
3
-
4
-
5
-
6
-
7
-
8
-
9
-
10
-
11
-
12
-
13
-
14
-
15
-
16
-
17
-
18
-
19
-
20
-
21
-
22
-
23
-
24
-
25
-
26
-
27
-
28
-
29
-
30
-
31
-
32
-
 33
33 -
 34
34 -
 35
35 -
 36
36 -
 37
37 -
 38
38 -
 39
39 -
 40
40 -
 41
41 -
 42
42 -
 43
43 -
 44
44 -
 45
45 -
 46
46 -
 47
47 -
 48
48 -
 49
49 -
 50
50 -
 51
51 -
 52
52 -
 53
53 -
54
-
55
-
56
-
57
-
58
-
59
-
60
-
61
-
62
-
63
-
64
-
65
-
66
-
67
-
68
-
69
-
70
-
71
-
72
-
73
-
74
-
75
-
76
-
77
-
78
-
79
-
80
-
81
-
82
-
83
-
84
-
85
-
86
-
87
-
88
-
89
-
90
-
91
-
92
-
93
-
94
-
95
-
96
-
97
-
98
-
99
-
100
-
101
-
102
-
103
-
104
-
105
-
106
-
107
-
108
-
109
-
110
-
111
-
112
-
113
-
114
-
115
-
116
 |
 |

Management’s Discussion
41Xerox 2011 Annual Report
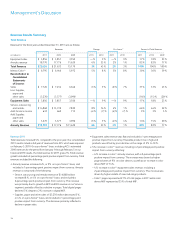
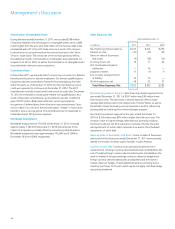
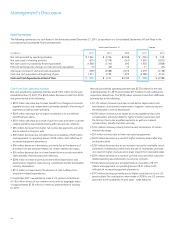
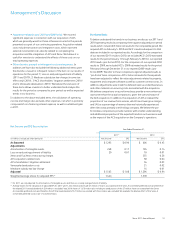
Services segment revenues for the three years ended December 31, 2011 were as follows:
Revenue Change Pro-forma(1) Change
(in millions) 2011 2010 2009 2011 2010 2011 2010
Business Processing Outsourcing $ 6,035 $ 5,112 $ 94 18% * 8% 8%
Document Outsourcing 3,584 3,297 3,382 9% (3)% 9% (3)%
Information Technology
Outsourcing 1,326 1,249 — 6% * (4)% —
Less: Intra-segment Elimination (108) (21) — * * * —
Total Services Revenue $ 10,837 $ 9,637 $ 3,476 12% 177% 6% 3%
* Percentage not meaningful.
Note:The Services segment is discussed on a pro-forma(1) basis. In
2011, for comparison purposes, we adjust our historical 2010 results
to include ACS’s 2010 estimated results for the period from January 1
through February 5, 2010. In 2010, for comparison purposes, we adjust
our historical 2009 results to include ACS’s 2009 estimated results for the
period from February 6 through December 31, 2009. We believe these
pro-forma comparisons provide a perspective on the impact of the ACS
acquisition on our results and trends. Refer to the “Non-GAAP Financial
Measures” section for a further explanation and discussion of this non-
GAAP presentation.
Revenue2011
Services revenue of $10,837 million increased 12%, or 6% on a pro-
forma(1) basis, with no impact from currency.
•BPO revenue had pro-forma(1) revenue growth of 8% and represented
55% of total Services revenue. The growth in BPO was primarily driven
by acquisitions over the past two years consistent with our strategy
to expand our service offerings through “tuck-in” acquisitions. BPO
growth was also driven to a lesser extent by growth in the healthcare
payer, human resources services, business process solutions and
transportation solutions businesses.
•DO revenue increased 9%, including a 2-percentage point positive
impact from currency, and represented 33% of total Services revenue.
The increase reflects an improving growth trend from our partner print
services offerings as well as new signings.
•ITO revenue on a pro-forma(1) basis decreased 4% and represented
12% of total Services revenue. The decrease in ITO revenue was
driven by lower third-party equipment sales as well as the impact
of lower contract renewals, partially offset by growth in new
commercial business.
SegmentMargin2011
Services segment margin of 11.1% decreased 0.6-percentage points, or
0.3-percentage points on a pro-forma(1) basis, from the prior year, as the
gross margin decline, which was driven by the ramping of new services
contracts and the impact of lower contract renewals, more than offset the
lower costs and expenses from restructuring and synergy savings.
Metrics
Pipeline
Our total services sales pipeline at December 31, 2011, including synergy
opportunities, grew 5% over the prior year. We have been able to maintain
a significant pipeline since the ACS acquisition. This sales pipeline includes
the Total Contract Value (“TCV”) of new business opportunities that
potentially could be contracted within the next six months and excludes
business opportunities with estimated annual recurring revenue in excess
of $100 million.
Signings
Signings are defined as estimated future revenues from contracts signed
during the period, including renewals of existing contracts.
TCV represents the estimated future contract revenue for pipeline or
signed contracts for signings, as applicable.
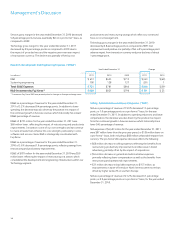
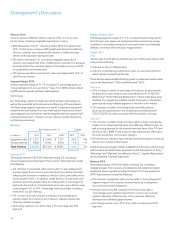
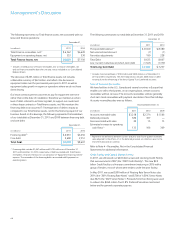
Signings were as follows:
Year Ended December 31,
(in billions) 2011 2010
BPO $ 6.8 $ 10.0
DO 4.4 3.3
ITO 3.4 1.3
Total Signings $ 14.6 $ 14.6
Services signings were an estimated $14.6 billion in TCV for 2011 and were
flat as compared to the prior year and were impacted by the cyclicality of
large deals, particularly the California Medicaid signing in 2010. However,
signings did trend positively in 2011, increasing sequentially for the last
three quarters of the year. Estimated services signings of $14.6 billion in
2010 increased by 13% as compared to the comparable prior-year period,
driven by strong signings in all lines of businesses.