Xerox 2011 Annual Report Download - page 46
Download and view the complete annual report
Please find page 46 of the 2011 Xerox annual report below. You can navigate through the pages in the report by either clicking on the pages listed below, or by using the keyword search tool below to find specific information within the annual report.-
 1
1 -
2
-
3
-
4
-
5
-
6
-
7
-
8
-
9
-
10
-
11
-
12
-
13
-
14
-
15
-
16
-
17
-
18
-
19
-
20
-
21
-
22
-
23
-
24
-
25
-
26
-
27
-
28
-
29
-
30
-
31
-
32
-
33
-
34
-
35
-
 36
36 -
 37
37 -
 38
38 -
 39
39 -
 40
40 -
 41
41 -
 42
42 -
 43
43 -
 44
44 -
 45
45 -
 46
46 -
 47
47 -
 48
48 -
 49
49 -
 50
50 -
 51
51 -
 52
52 -
 53
53 -
 54
54 -
 55
55 -
 56
56 -
57
-
58
-
59
-
60
-
61
-
62
-
63
-
64
-
65
-
66
-
67
-
68
-
69
-
70
-
71
-
72
-
73
-
74
-
75
-
76
-
77
-
78
-
79
-
80
-
81
-
82
-
83
-
84
-
85
-
86
-
87
-
88
-
89
-
90
-
91
-
92
-
93
-
94
-
95
-
96
-
97
-
98
-
99
-
100
-
101
-
102
-
103
-
104
-
105
-
106
-
107
-
108
-
109
-
110
-
111
-
112
-
113
-
114
-
115
-
116
 |
 |

Management’s Discussion
44
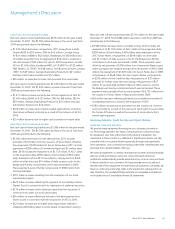
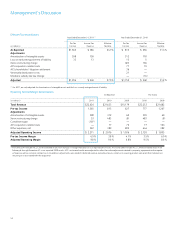
CashFlowsfromOperatingActivities
Net cash provided by operating activities was $1,961 million for the year
ended December 31, 2011. The $765 million decrease in cash from 2010
was primarily due to the following:
•$533 million decrease due to lower benefit from changes in accounts
payable and accrued compensation, primarily related to the timing of
payments as well as lower spending.
•$189 million decrease due to higher contributions to our defined
benefit pension plans.
•$101 million decrease as a result of up-front costs and other customer-
related spending associated primarily with new services contracts.
•$65 million decrease from higher net income tax payments, primarily
due to refunds in the prior year.
•$49 million decrease due to higher finance receivables of $39 million
and equipment on operating leases of $10 million, both reflective of
increased equipment placements.
•$46 million decrease in derivatives, primarily due to the absence of
proceeds from the early termination of certain interest rate swaps.
•$16 million decrease due to a lower benefit from accounts receivable
sales, partially offset by improved collections.
•$290 million increase in pre-tax income before depreciation and
amortization, litigation, restructuring, curtailment and the Venezuelan
currency devaluation.
•$113 million increase due to the absence of cash outflows from
acquisition-related expenditures.
In September 2011, we elected to make a U.S. pension contribution
of 16.6 million shares of our common stock, with an aggregate value
of approximately $130 million, to meet our planned level of funding
for 2011.
Net cash provided by operating activities was $2,726 million for the year
ended December 31, 2010 and includes $113 million of cash outflows for
acquisition-related costs. The $518 million increase in cash from 2009 was
primarily due to the following:
•$1,173 million increase in pre-tax income before depreciation and
amortization, stock-based compensation, litigation, restructuring and
the Venezuelan currency devaluation.
•$458 million increase due to higher accounts payable and accrued
compensation, primarily related to higher inventory purchases and
the timing of accounts payable payments, as well as increased
compensation, benefit and other accruals.
•$141 million increase primarily from the early termination of certain
interest rate swaps.
•$57 million increase due to lower restructuring payments.
•$470 million decrease as a result of higher inventory levels reflecting
increased activity.
•$367 million decrease due to an increase in accounts receivable, net of
collections of deferred proceeds from the sale of receivables, primarily
as a result of higher revenues and a lower impact from receivable sales.
•$216 million decrease as a result of up-front costs and other customer-
related spending associated with our services contracts.
•$140 million decrease due to higher finance receivables of $119
million and equipment on operating leases of $21 million, both
reflective of increased equipment placements.
•$115 million decrease primarily due to higher contributions to our U.S.
pension plans. No contributions were made in 2009 to our U.S. pension
plans due to the availability of prior years’ credit balances.
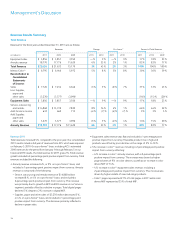
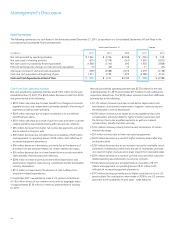
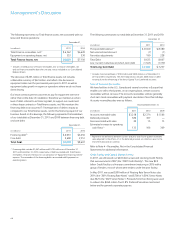
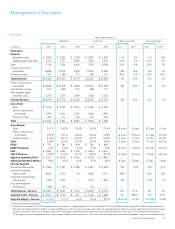
Cash Flow Analysis
The following summarizes our cash flows for the three years ended December 31, 2011, as reported in our Consolidated Statements of Cash Flows in the
accompanying Consolidated Financial Statements:
Year Ended December 31, Change
(in millions) 2011 2010 2009 2011 2010
Net cash provided by operating activities $ 1,961 $ 2,726 $ 2,208 $ (765) $ 518
Net cash used in investing activities (675) (2,178) (343) 1,503 (1,835)
Net cash (used in) provided by financing activities (1,586) (3,116) 692 1,530 (3,808)
Effect of exchange rate changes on cash and cash equivalents (9) (20) 13 11 (33)
(Decrease) increase in cash and cash equivalents (309) (2,588) 2,570 2,279 (5,158)
Cash and cash equivalents at beginning of year 1,211 3,799 1,229 (2,588) 2,570
Cash and Cash Equivalents at End of Year $ 902 $ 1,211 $ 3,799 $ (309) $ (2,588)