Xerox 2011 Annual Report Download - page 102
Download and view the complete annual report
Please find page 102 of the 2011 Xerox annual report below. You can navigate through the pages in the report by either clicking on the pages listed below, or by using the keyword search tool below to find specific information within the annual report.-
 1
1 -
2
-
3
-
4
-
5
-
6
-
7
-
8
-
9
-
10
-
11
-
12
-
13
-
14
-
15
-
16
-
17
-
18
-
19
-
20
-
21
-
22
-
23
-
24
-
25
-
26
-
27
-
28
-
29
-
30
-
31
-
32
-
33
-
34
-
35
-
36
-
37
-
38
-
39
-
40
-
41
-
42
-
43
-
44
-
45
-
46
-
47
-
48
-
49
-
50
-
51
-
52
-
53
-
54
-
55
-
56
-
57
-
58
-
59
-
60
-
61
-
62
-
63
-
64
-
65
-
66
-
67
-
68
-
69
-
70
-
71
-
72
-
73
-
74
-
75
-
76
-
77
-
78
-
79
-
80
-
81
-
82
-
83
-
84
-
85
-
86
-
87
-
88
-
89
-
90
-
91
-
 92
92 -
 93
93 -
 94
94 -
 95
95 -
 96
96 -
 97
97 -
 98
98 -
 99
99 -
 100
100 -
 101
101 -
 102
102 -
 103
103 -
 104
104 -
 105
105 -
 106
106 -
 107
107 -
 108
108 -
 109
109 -
 110
110 -
 111
111 -
 112
112 -
113
-
114
-
115
-
116
 |
 |

100
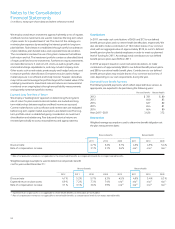
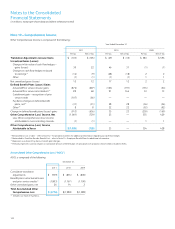
At December 31, 2011, the aggregate intrinsic value of PSs outstanding
was $78. The total intrinsic value of PSs and the actual tax benefit realized
for the tax deductions for vested PSs were as follows:
Year Ended December 31,
Vested Performance Shares 2011 2010 2009
Total intrinsic value of vested PSs $17 $12 $15
Tax benefit realized for vested PSs
tax deductions 6 5 6
We account for PSs using fair value determined as of the grant date. If the
stated targets are not met, any recognized compensation cost would be
reversed. As of December 31, 2011, there was $62 of total unrecognized
compensation cost related to nonvested PSs; this cost is expected to be
recognized ratably over a remaining weighted-average contractual term of
1.9 years.
Stock options
EmployeeStockOptions: With the exception of the conversion of ACS
options in connection with the ACS acquisition (see below), we have not
issued any new stock options associated with our employee long-term
incentive plan since 2004. All stock options previously issued under our
employee long-term incentive plan and currently outstanding are fully
vested and exercisable and generally expire between eight and 10 years
from the date of grant.
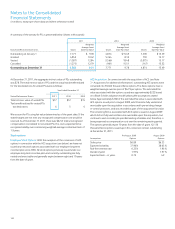
ACSAcquisition:In connection with the acquisition of ACS (see Note
3 – Acquisitions for additional information), outstanding ACS options were
converted into 96,662 thousand Xerox options. The Xerox options have a
weighted average exercise price of $6.79 per option. The estimated fair
value associated with the options issued was approximately $222 based
on a Black-Scholes valuation model utilizing the assumptions stated
below. Approximately $168 of the estimated fair value is associated with
ACS options issued prior to August 2009, which became fully vested and
exercisable upon the acquisition in accordance with pre-existing change-
in-control provisions, and was recorded as part of the acquisition fair value.
The remaining $54 is associated with ACS options issued in August 2009
which did not fully vest and become exercisable upon the acquisition, but
continue to vest according to specified vesting schedules and, therefore, is
being expensed as compensation cost over the remaining vesting period.
The options generally expire 10 years from the date of grant. 42,136
thousand Xerox options issued upon this conversion remain outstanding
at December 31, 2011.
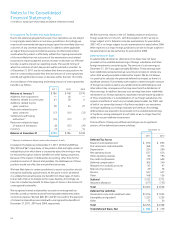
Pre-August 2009 August 2009
Assumptions Options Options
Strike price $6.89 $6.33
Expected volatility 37.90% 38.05%
Risk-free interest rate 0.23% 1.96%
Dividend yield 1.97% 1.97%
Expected term – in years 0.75 4.2
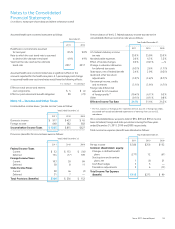
A summary of the activity for PSs is presented below (shares in thousands):
2011 2010 2009
Weighted Weighted Weighted
Average Grant Average Grant Average Grant
Nonvested Restricted Stock Units Shares Date Fair Value Shares Date Fair Value Shares Date Fair Value
Outstanding at January 1 7,771 $ 9.78 4,874 $ 15.49 7,378 $ 15.39
Granted 4,852 10.42 5,364 8.10 718 15.17
Vested (1,587) 12.84 (1,566) 18.48 (3,075) 15.17
Cancelled (1,273) 12.79 (901) 15.51 (147) 15.52
Outstanding at December 31
9,763 9.21 7,771 9.78 4,874 15.49
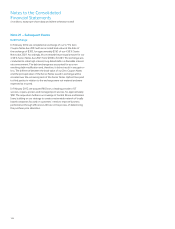
Notes to the Consolidated
Financial Statements
(in millions, except per-share data and where otherwise noted)