Xerox 2011 Annual Report Download - page 55
Download and view the complete annual report
Please find page 55 of the 2011 Xerox annual report below. You can navigate through the pages in the report by either clicking on the pages listed below, or by using the keyword search tool below to find specific information within the annual report.
Management’s Discussion
53Xerox 2011 Annual Report
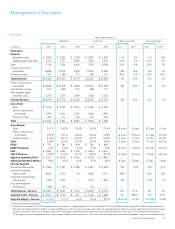
Pro-forma:
Year Ended December 31,
As Reported Pro-forma(1) As Reported Change Pro-forma Change
(in millions) 2011 2010 2009 2010 2009 2011 2010 2011 2010(2)
Total Xerox
Revenue:
Equipment sales $ 3,856 $ 3,857 $ 3,550 $ 3,857 $ 3,550 —% 9% —% 9%
Supplies, paper and other 3,270 3,377 3,096 3,402 3,234 (3)% 9% (4)% 4%
Sales 7,126 7,234 6,646 7,259 6,784 (1)% 9% (2)% 7%
Service, outsourcing
and rentals 14,868 13,739 7,820 14,333 13,585 8% 76% 4% 1%
Finance income 632 660 713 660 713 (4)% (7)% (4)% (7)%
Total Revenues $ 22,626 $ 21,633 $ 15,179 $ 22,252 $ 21,082 5% 43% 2% 3%
Service, outsourcing
and rentals $ 14,868 $ 13,739 $ 7,820 $ 14,333 $ 13,585 8% 76% 4% 1%
Add: Finance income 632 660 713 660 713
Add: Supplies, paper
and other sales 3,270 3,377 3,096 3,402 3,234
Annuity Revenue $ 18,770 $ 17,776 $ 11,629 $ 18,395 $ 17,532 6% 53% 2% 1%
Gross Profit:
Sales $ 2,429 $ 2,493 $ 2,251 $ 2,494 $ 2,269
Service, outsourcing
and rentals 4,599 4,544 3,332 4,646 4,585
Finance income 401 414 442 414 442
Total $ 7,429 $ 7,451 $ 6,025 $ 7,554 $ 7,296
Gross Margin:
Sales 34.1% 34.5% 33.9% 34.4% 33.4% (0.4) pts 0.6 pts (0.3) pts 1.1 pts
Service, outsourcing
and rentals 30.9% 33.1% 42.6% 32.4% 33.8% (2.2) pts (9.5) pts (1.5) pts (0.7) pts
Finance income 63.4% 62.7% 62.0% 62.7% 62.0% 0.7 pts 0.7 pts 0.7 pts 0.7 pts
Total 32.8% 34.4% 39.7% 33.9% 34.6% (1.6) pts (5.3) pts (1.1) pts (0.2) pts
RD&E $ 721 $ 781 $ 840 $ 781 $ 840
RD&E % Revenue 3.2% 3.6% 5.5% 3.5% 4.0% (0.4) pts (1.9) pts (0.3) pts (0.4) pts
SAG $ 4,497 $ 4,594 $ 4,149 $ 4,653 $ 4,651
SAG % Revenue 19.9% 21.2% 27.3% 20.9% 22.1% (1.3) pts (6.1) pts (1.0) pts (0.9) pts
Adjusted Operating Profit $ 2,211 $ 2,076 $ 1,036 $ 2,120 $ 1,805
Adjusting Operating Margin 9.8% 9.6% 6.8% 9.5% 8.6% 0.2 pts 2.8 pts 0.3 pts 1.0 pts
Services Segment
Document Outsourcing $ 3,584 $ 3,297 $ 3,382 $ 3,297 $ 3,382 9% (3)% 9% (3)%
Business Processing
Outsourcing(2) 6,035 5,112 94 5,603 4,751 18% * 8% 8%
Information Technology
Outsourcing 1,326 1,249 — 1,377 1,246 6% * (4)% —%
Less: Intra-segment
Eliminations (108) (21) — (21) — * * * *
Total Revenue – Services $ 10,837 $ 9,637 $ 3,476 $ 10,256 $ 9,379 12% 177% 6% 3%
Segment Profit – Services $ 1,207 $ 1,132 $ 231 $ 1,166 $ 1,008 7% 390% 4% 12%
Segment Margin – Services 11.1% 11.7% 6.6% 11.4% 10.7% (0.6) pts 5.1 pts (0.3) pts 1.0 pts
* Percentage change not meaningful.
(1) 2010 pro-forma includes ACS’s 2010 estimated results from January 1 through February 5, 2010 in our reported 2010 results. 2009 pro-forma includes ACS’s 2009 estimated results from
February 6 through December 31, 2009 in our reported 2009 results. The ACS results were adjusted to reflect fair value adjustments related to property, equipment and computer software
as well as customer contract costs. In addition, adjustments were made for deferred revenue, exited businesses and other material non-recurring costs associated with the acquisition.
(2) 2010 changes for Xerox excluding ACS results for gross margin, RD&E and SAG were (0.2) pts, (0.5) pts and (0.8) pts, respectively, which were comparable to the pro-forma changes noted.


