Xerox 2011 Annual Report Download - page 44
Download and view the complete annual report
Please find page 44 of the 2011 Xerox annual report below. You can navigate through the pages in the report by either clicking on the pages listed below, or by using the keyword search tool below to find specific information within the annual report.-
 1
1 -
2
-
3
-
4
-
5
-
6
-
7
-
8
-
9
-
10
-
11
-
12
-
13
-
14
-
15
-
16
-
17
-
18
-
19
-
20
-
21
-
22
-
23
-
24
-
25
-
26
-
27
-
28
-
29
-
30
-
31
-
32
-
33
-
 34
34 -
 35
35 -
 36
36 -
 37
37 -
 38
38 -
 39
39 -
 40
40 -
 41
41 -
 42
42 -
 43
43 -
 44
44 -
 45
45 -
 46
46 -
 47
47 -
 48
48 -
 49
49 -
 50
50 -
 51
51 -
 52
52 -
 53
53 -
 54
54 -
55
-
56
-
57
-
58
-
59
-
60
-
61
-
62
-
63
-
64
-
65
-
66
-
67
-
68
-
69
-
70
-
71
-
72
-
73
-
74
-
75
-
76
-
77
-
78
-
79
-
80
-
81
-
82
-
83
-
84
-
85
-
86
-
87
-
88
-
89
-
90
-
91
-
92
-
93
-
94
-
95
-
96
-
97
-
98
-
99
-
100
-
101
-
102
-
103
-
104
-
105
-
106
-
107
-
108
-
109
-
110
-
111
-
112
-
113
-
114
-
115
-
116
 |
 |

Management’s Discussion
42
Revenue2010
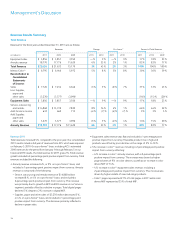
Services revenue of $9,637 million increased 177%, or 3% on a pro-
forma(1) basis, including a negligible impact from currency.
•BPO delivered pro-forma(1) revenue growth of 8% and represented
53% of total Services revenue. BPO growth was driven by healthcare
services, customer care, transportation solutions, healthcare payer
services and acquisitions during the year.
•DO revenue decreased 3%, including a negligible impact from
currency, and represented 34% of total Services revenue. The decrease
primarily reflects the continued impact of the weak economy in 2010
on usage levels and renewal rates.
•ITO revenue was flat on a pro-forma(1) basis and represented 13% of
total Services revenue.
SegmentMargin2010
Services segment margin of 11.7% increased 5.1-percentage points, or
1.0-percentage points on a pro-forma(1) basis, from 2009, primarily driven
by BPO revenue growth and lower G&A expenses.
Technology
Our Technology segment includes the sale of products and supplies, as
well as the associated technical service and financing of those products.
The Technology segment represents our pre-ACS acquisition equipment-
related business exclusive of our document outsourcing business, which
was integrated into the Services segment together with the acquired ACS
outsourcing businesses – business process outsourcing and information
technology outsourcing.
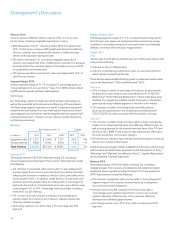
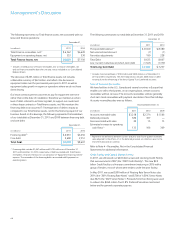
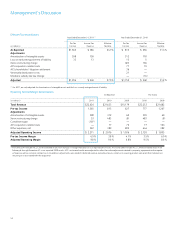
Revenue
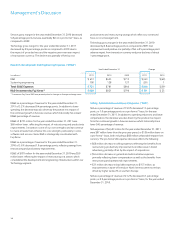
Year Ended December 31, Change
(in millions) 2011 2010 2009 2011 2010
Equipment sales $ 3,277 $ 3,404 $ 3,137 (4)% 9%
Annuity revenue 6,982 6,945 6,930 1% —%
Total Revenue $ 10,259 $ 10,349 $ 10,067 (1)% 3%
Revenue2011
Technology revenue of $10,259 million decreased 1%, including a
2-percentage point positive impact from currency. Total revenues include
the following:
•4% decrease in equipment sales revenue with a 1-percentage point
positive impact from currency, primarily driven by a decline in Europe
reflecting the economic conditions in the Euro Zone, particularly in the
fourth quarter of 2011. In addition, install declines of entry and mono
products were only partially offset by install growth in mid-range and
high-end color products. Consistent with prior years, price declines were
in the range of 5% to 10%. Technology revenue excludes increasing
revenues in our DO offerings.
•1% increase in annuity revenue, including a 2-percentage point
positive impact from currency. An increase in supplies revenue was
offset by a decline in pages.
•Technology revenue mix is 22% entry, 57% mid-range and 21%
high-end.
SegmentMargin2011
Technology segment margin of 11.1% increased 0.6-percentage points
from the prior year. Lower cost and expense from restructuring savings,
in addition to an increase in equity in net income from unconsolidated
affiliates, more than offset the gross margin decline.
Installs2011
Entry
4% decrease in entry black-and-white and color multifunction devices and
color printers reflecting:
•A decline in sales to OEM partners
•A decline in developing markets due in part to a very strong 2010 in
which installs increased significantly.
These declines were partially offset by growth in newly launched products
such as the WorkCentre® 3045 and WorkCentre® 6015.
Mid-range
•26% increase in installs of mid-range color devices, driven primarily
by demand for new products such as the WorkCentre® 7530/7535,
WorkCentre® 7545/7556 and WorkCentre® 7120 and the Xerox Color
550/560. This growth has enabled market share gains in the fastest-
growing and most profitable segment of the office color market.
•2% increase in installs of mid-range black-and-white devices,
driven by strong demand for the recently launched WorkCentre®
5325/5330/5335 product, partially offset by declines in Europe.
High-end
•7% increase in installs of high-end color systems, driven primarily by
installs of our market-leading Xerox Color 800 and 1000 and iGen, as
well as strong demand for the recently launched Xerox Color 770 and
the DocuColor™ 8080. These products have improved our offerings in
the entry production color product category.
•8% decrease in installs of high-end black-and-white systems, driven by
declines across most product areas.
Install activity percentages include installations for Document Outsourcing
and the Xerox-branded product shipments to GIS. Descriptions of “Entry,”
“Mid-range” and “High-end” are defined in Note 2 – Segment Reporting in
the Consolidated Financial Statements.
Revenue2010
Technology revenue of $10,349 million increased 3%, including a
negligible impact from currency, and reflected solid install and related
equipment revenue growth including the launch of 21 new products in
2010. Total revenues include the following:
•9% increase in equipment sales revenue, with a 1-percentage point
negative impact from currency, driven primarily by install growth
across all color product categories
•Annuity revenue was flat compared to the prior year, with a
1-percentage point negative impact from currency, as increased
supplies sales were offset by lower service revenues, reflecting
decreased but stabilizing page volumes
•Technology revenue mix is 22% entry, 56% mid-range and 22%
high-end.