Xerox 2011 Annual Report Download - page 101
Download and view the complete annual report
Please find page 101 of the 2011 Xerox annual report below. You can navigate through the pages in the report by either clicking on the pages listed below, or by using the keyword search tool below to find specific information within the annual report.-
 1
1 -
2
-
3
-
4
-
5
-
6
-
7
-
8
-
9
-
10
-
11
-
12
-
13
-
14
-
15
-
16
-
17
-
18
-
19
-
20
-
21
-
22
-
23
-
24
-
25
-
26
-
27
-
28
-
29
-
30
-
31
-
32
-
33
-
34
-
35
-
36
-
37
-
38
-
39
-
40
-
41
-
42
-
43
-
44
-
45
-
46
-
47
-
48
-
49
-
50
-
51
-
52
-
53
-
54
-
55
-
56
-
57
-
58
-
59
-
60
-
61
-
62
-
63
-
64
-
65
-
66
-
67
-
68
-
69
-
70
-
71
-
72
-
73
-
74
-
75
-
76
-
77
-
78
-
79
-
80
-
81
-
82
-
83
-
84
-
85
-
86
-
87
-
88
-
89
-
90
-
 91
91 -
 92
92 -
 93
93 -
 94
94 -
 95
95 -
 96
96 -
 97
97 -
 98
98 -
 99
99 -
 100
100 -
 101
101 -
 102
102 -
 103
103 -
 104
104 -
 105
105 -
 106
106 -
 107
107 -
 108
108 -
 109
109 -
 110
110 -
 111
111 -
112
-
113
-
114
-
115
-
116
 |
 |

99Xerox 2011 Annual Report
Stock-BasedCompensation
We have a long-term incentive plan whereby eligible employees may be
granted restricted stock units (“RSUs”), performance shares (“PSs”) and
non-qualified stock options. As more fully discussed below, at December
31, 2011 there was an aggregate of $209 of unrecognized stock-based
compensation related to all of our equity-based compensation programs
which will be expensed over the next two years.
We grant PSs and RSUs in order to continue to attract and retain
employees and to better align employees’ interests with those of
our shareholders. Each of these awards is subject to settlement with
newly issued shares of our common stock. At December 31, 2011
and 2010, 31 million and 30 million shares, respectively, were available
for grant of awards.
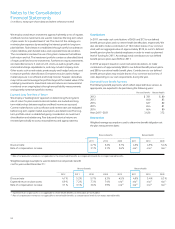
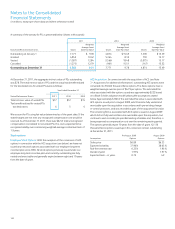
At December 31, 2011, the aggregate intrinsic value of RSUs outstanding
was $269. The total intrinsic value and actual tax benefit realized for the
tax deductions for vested RSUs were as follows:
Year Ended December 31,
Vested Restricted Stock Units 2011 2010 2009
Total intrinsic value of vested RSUs $56 $31 $19
Tax benefit realized for vested RSUs
tax deductions 22 10 6
At December 31, 2011, there was $124 of total unrecognized
compensation cost related to nonvested RSUs, which is expected to be
recognized ratably over a remaining weighted-average contractual term
of 1.3 years.
Stock-based compensation expense was as follows:
Year Ended December 31,
2011 2010 2009
Stock-based compensation
expense, pre-tax $123 $123 $85
Income tax benefit recognized
in earnings 47 47 33
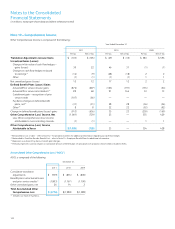
RestrictedStockUnits: Compensation expense is based upon the
grant date market price for most awards. The primary grant in 2009 had
a market-based condition and therefore the grant date price was based
on a Monte Carlo simulation. Compensation expense is recorded over
the vesting period, which ranges from three to five years from the date
of grant. A summary of the activity for RSUs is presented below (shares
in thousands):
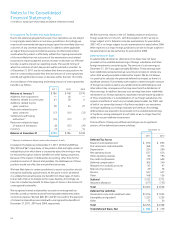
PerformanceShares: We grant officers and selected executives PSs that
vest contingent upon meeting pre-determined Revenue, Earnings per
Share (“EPS”) and Cash Flow from Operations targets. These shares entitle
the holder to one share of common stock, payable after a three-year
period and the attainment of the stated goals. If the annual actual results
for revenue exceed the stated targets and if the cumulative three-year
actual results for EPS and Cash Flow from Operations exceed the stated
targets, then the plan participants have the potential to earn additional
shares of common stock. This overachievement cannot exceed 50% for
officers and 25% for non-officers of the original grant.
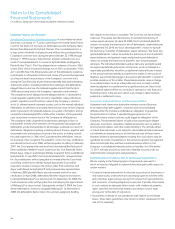
In connection with the ACS acquisition, selected ACS executives received
a special one-time grant of PSs that vest over a three-year period ending
February 2013 contingent upon ACS meeting pre-determined annual
earnings targets. These shares entitle the holder to one share of common
stock, payable after the three-year period and the attainment of the
targets. The aggregate number of shares that may be delivered based
on achievement of the targets was determined on the date of grant and
ranges in value as follows: 50% of base salary (threshold); 100% of base
salary (target); and 200% of base salary plus 50% of the value of the
August 2009 options (maximum).
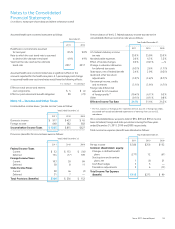
2011 2010 2009
Weighted Weighted Weighted
Average Grant Average Grant Average Grant
Nonvested Restricted Stock Units Shares Date Fair Value Shares Date Fair Value Shares Date Fair Value
Outstanding at January 1 32,431 $ 8.68 25,127 $ 10.18 14,037 $ 15.43
Granted 8,035 10.66 11,845 8.56 15,268 6.69
Vested (5,225) 11.64 (3,671) 18.22 (3,764) 15.17
Cancelled (1,457) 8.57 (870) 10.36 (414) 13.94
Outstanding at December 31 33,784 8.70 32,431 8.68 25,127 10.18
Notes to the Consolidated
Financial Statements
(in millions, except per-share data and where otherwise noted)