Xerox 2011 Annual Report Download - page 93
Download and view the complete annual report
Please find page 93 of the 2011 Xerox annual report below. You can navigate through the pages in the report by either clicking on the pages listed below, or by using the keyword search tool below to find specific information within the annual report.-
 1
1 -
2
-
3
-
4
-
5
-
6
-
7
-
8
-
9
-
10
-
11
-
12
-
13
-
14
-
15
-
16
-
17
-
18
-
19
-
20
-
21
-
22
-
23
-
24
-
25
-
26
-
27
-
28
-
29
-
30
-
31
-
32
-
33
-
34
-
35
-
36
-
37
-
38
-
39
-
40
-
41
-
42
-
43
-
44
-
45
-
46
-
47
-
48
-
49
-
50
-
51
-
52
-
53
-
54
-
55
-
56
-
57
-
58
-
59
-
60
-
61
-
62
-
63
-
64
-
65
-
66
-
67
-
68
-
69
-
70
-
71
-
72
-
73
-
74
-
75
-
76
-
77
-
78
-
79
-
80
-
81
-
82
-
 83
83 -
 84
84 -
 85
85 -
 86
86 -
 87
87 -
 88
88 -
 89
89 -
 90
90 -
 91
91 -
 92
92 -
 93
93 -
 94
94 -
 95
95 -
 96
96 -
 97
97 -
 98
98 -
 99
99 -
 100
100 -
 101
101 -
 102
102 -
 103
103 -
104
-
105
-
106
-
107
-
108
-
109
-
110
-
111
-
112
-
113
-
114
-
115
-
116
 |
 |
91Xerox 2011 Annual Report
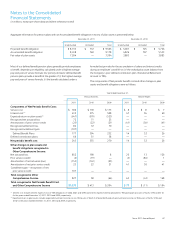
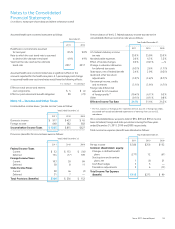
The following table represents a rollforward of the defined benefit plans assets measured using significant unobservable inputs (Level 3 assets):
Fair Value Measurement Using Significant Unobservable Inputs (Level 3)
Private Guaranteed
Equity/Venture Insurance
Real Estate Capital Contracts Hedge Funds Other Total
December 31, 2009 $ 237 $ 286 $ 130 $ 4 $ — $ 657
Purchases 41 30 1 — — 72
Sales (34) (38) (13) — — (85)
Net transfers in from Level 1 — — 1 — — 1
Realized gains (losses) 5 28 (2) — — 31
Unrealized gains (losses) 22 — (2) — — 20
Currency translation (6) — (9) — — (15)
Other 10 1 (9) — (1) 1
December 31, 2010 275 307 97 4 (1) 682
Purchases 69 30 3 — — 102
Sales (6) (61) (3) (1) — (71)
Net transfers in from Level 1 2 — 12 — — 14
Net transfers in from Level 2 — — 9 — — 9
Realized gains (losses) — 46 (1) — — 45
Unrealized gains (losses) 18 (4) (4) — — 10
Currency translation (4) — (3) — — (7)
Other (2) — 6 — 1 5
December 31, 2011 $ 352 $ 318 $ 116 $ 3 $ — $ 789
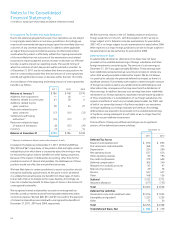
Our pension plan assets and benefit obligations at December 31, 2011
were as follows:
Fair Value Pension Net
of Pension Benefit Funded
(in billions) Plan Assets Obligations Status
U.S. funded $ 3.3 $ 4.3 $ (1.0)
U.S. unfunded — 0.3 (0.3)
Total U.S. $ 3.3 $ 4.6 $ (1.3)
U.K. 3.0 3.3 (0.3)
Canada 0.6 0.8 (0.2)
Other funded 1.4 1.3 0.1
Other unfunded — 0.5 (0.5)
Total $ 8.3 $ 10.5 $ (2.2)
InvestmentStrategy
The target asset allocations for our worldwide plans were:
2011 2010
Equity investments 41% 42%
Fixed-income investments 45% 45%
Real estate 7% 7%
Private equity 4% 4%
Other 3% 2%
Total Investment Strategy
100% 100%
Notes to the Consolidated
Financial Statements
(in millions, except per-share data and where otherwise noted)