Xerox 2011 Annual Report Download - page 75
Download and view the complete annual report
Please find page 75 of the 2011 Xerox annual report below. You can navigate through the pages in the report by either clicking on the pages listed below, or by using the keyword search tool below to find specific information within the annual report.-
 1
1 -
2
-
3
-
4
-
5
-
6
-
7
-
8
-
9
-
10
-
11
-
12
-
13
-
14
-
15
-
16
-
17
-
18
-
19
-
20
-
21
-
22
-
23
-
24
-
25
-
26
-
27
-
28
-
29
-
30
-
31
-
32
-
33
-
34
-
35
-
36
-
37
-
38
-
39
-
40
-
41
-
42
-
43
-
44
-
45
-
46
-
47
-
48
-
49
-
50
-
51
-
52
-
53
-
54
-
55
-
56
-
57
-
58
-
59
-
60
-
61
-
62
-
63
-
64
-
 65
65 -
 66
66 -
 67
67 -
 68
68 -
 69
69 -
 70
70 -
 71
71 -
 72
72 -
 73
73 -
 74
74 -
 75
75 -
 76
76 -
 77
77 -
 78
78 -
 79
79 -
 80
80 -
 81
81 -
 82
82 -
 83
83 -
 84
84 -
 85
85 -
86
-
87
-
88
-
89
-
90
-
91
-
92
-
93
-
94
-
95
-
96
-
97
-
98
-
99
-
100
-
101
-
102
-
103
-
104
-
105
-
106
-
107
-
108
-
109
-
110
-
111
-
112
-
113
-
114
-
115
-
116
 |
 |

73Xerox 2011 Annual Report
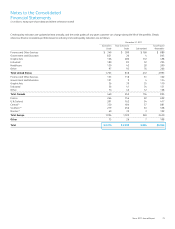
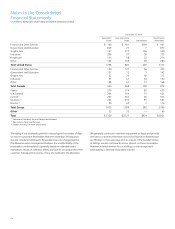
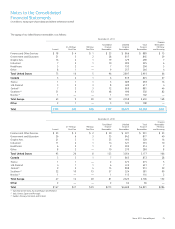
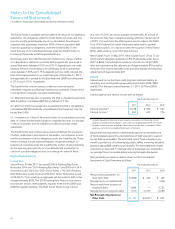
Credit-quality indicators are updated at least annually, and the credit quality of any given customer can change during the life of the portfolio. Details
about our finance receivables portfolio based on industry and credit-quality indicators are as follows:
December 31, 2011
Investment Non-investment Total Finance
Grade Grade Substandard Receivables
Finance and Other Services $ 349 $ 380 $ 160 $ 889
Government and Education 821 20 4 845
Graphic Arts 126 200 172 498
Industrial 180 83 32 295
Healthcare 130 42 28 200
Other 97 93 76 266
Total United States 1,703 818 472 2,993
Finance and Other Services 153 118 51 322
Government and Education 121 9 4 134
Graphic Arts 36 39 35 110
Industrial 56 41 34 131
Other 74 42 12 128
Total Canada 440 249 136 825
France 246 354 92 692
U.K./Ireland 201 162 54 417
Central(1) 330 494 57 881
Southern(2) 219 256 63 538
Nordics(3) 60 39 3 102
Total Europe 1,056 1,305 269 2,630
Other 75 26 7 108
Total $ 3,274 $ 2,398 $ 884 $ 6,556
Notes to the Consolidated
Financial Statements
(in millions, except per-share data and where otherwise noted)