Xerox 2011 Annual Report Download - page 37
Download and view the complete annual report
Please find page 37 of the 2011 Xerox annual report below. You can navigate through the pages in the report by either clicking on the pages listed below, or by using the keyword search tool below to find specific information within the annual report.-
 1
1 -
2
-
3
-
4
-
5
-
6
-
7
-
8
-
9
-
10
-
11
-
12
-
13
-
14
-
15
-
16
-
17
-
18
-
19
-
20
-
21
-
22
-
23
-
24
-
25
-
26
-
 27
27 -
 28
28 -
 29
29 -
 30
30 -
 31
31 -
 32
32 -
 33
33 -
 34
34 -
 35
35 -
 36
36 -
 37
37 -
 38
38 -
 39
39 -
 40
40 -
 41
41 -
 42
42 -
 43
43 -
 44
44 -
 45
45 -
 46
46 -
 47
47 -
48
-
49
-
50
-
51
-
52
-
53
-
54
-
55
-
56
-
57
-
58
-
59
-
60
-
61
-
62
-
63
-
64
-
65
-
66
-
67
-
68
-
69
-
70
-
71
-
72
-
73
-
74
-
75
-
76
-
77
-
78
-
79
-
80
-
81
-
82
-
83
-
84
-
85
-
86
-
87
-
88
-
89
-
90
-
91
-
92
-
93
-
94
-
95
-
96
-
97
-
98
-
99
-
100
-
101
-
102
-
103
-
104
-
105
-
106
-
107
-
108
-
109
-
110
-
111
-
112
-
113
-
114
-
115
-
116
 |
 |

Management’s Discussion
35Xerox 2011 Annual Report
– Supplies, paper and other sales of $3,377 million increased 9%,
or 4% on a pro-forma(1) basis, with a 1-percentage point negative
impact from currency. Growth in supplies revenues was partially
offset by a decline in paper sales.
•Equipment sales revenue increased 9% and included a 1-percentage
point negative impact from currency. Growth in install activity was
partially offset by price declines of approximately 5% and mix.
•8% increase in color(2) revenue, including a 1-percentage point
negative impact from currency reflecting:
– 5% increase in color(2) annuity revenue, including a 1-percentage
point negative impact from currency. The increase was driven by
higher printer supplies sales and higher page volumes.
– 12% increase in color(2) equipment sales revenue, including a
2-percentage point negative impact from currency. The increase was
driven by higher installs of new products.
– 9% growth in color pages(2) representing 23% of total pages in
2010, while color device MIF represented 31% of total MIF.
An analysis of the change in revenue for each business segment
is included in the “Operations Review of Segment Revenue and
Profit” section.
Refer to the “Non-GAAP Financial Measures” section for a further
explanation and discussion of this non-GAAP presentation.
Gross Margin
Gross margin for year ended December 31, 2011 of 32.8% decreased
1.6-percentage points, or 1.1-percentage points on a pro-forma(1) basis,
as compared to 2010. The decrease was driven by the ramping of new
services contracts, the impact of lower contract renewals, transaction
currency and the mix of higher services revenue.
Gross margin for year ended December 31, 2010 of 34.4% decreased
5.3-percentage points, or 0.2-percentage points on a pro-forma(1) basis,
as compared to 2009. The decrease is primarily due to the unfavorable
impact of year-over-year transaction currency.
Services gross margin for the year ended December 31, 2011 decreased
1.7-percentage points, or 1.2-percentage points on a pro-forma(1) basis,
as compared to 2010. The decrease is primarily due to the ramping
of new services contracts within BPO and ITO and the impact of lower
contract renewals.
Revenue2010
Total revenues increased 43% compared to the prior year. Our
consolidated 2010 results include ACS results subsequent to February 5,
2010, the effective date of the acquisition. On a pro-forma(1) basis, total
revenue for 2010 grew 3%. Currency had a negligible impact on total
revenues during 2010. Total revenues included the following:
•Annuity revenue increased 53%, or 1% on a pro-forma(1) basis, with a
1-percentage point negative impact from currency. The components
of annuity revenue were as follows:
– Service, outsourcing and rentals revenue of $13,739 million
increased 76%, or 1% on a pro-forma(1) basis, and included a
negligible impact from currency. The increase was driven by BPO
revenue that partially offset the declines in technical service revenue
which were driven by a continued but stabilizing decline in pages.
Total digital pages declined 4% while color pages increased 9%.
During 2010 digital MIF increased by 1% and color MIF increased
by 15%.
Operating Margin
The operating margin(3) for the year ended December 31, 2011 of 9.8%
increased 0.2-percentage points, or 0.3-percentage points on a pro-
forma(1) basis, as compared to 2010. The increase was due primarily to
disciplined cost and expense management.
The operating margin(3) for the year ended December 31, 2010 of 9.6%
increased 2.8-percentage points, or 1.0-percentage points on a pro-
forma(1) basis, as compared to 2009. The improvement reflects strong
revenue growth and continued disciplined cost and expense management.
Note: The acquisition of ACS increased the proportion of our revenue from
services, which has a lower gross margin and SAG as a percent of revenue
than we historically experienced when Xerox was primarily a technology
company. As a result, gross margins and SAG are also discussed below on a
pro-forma basis. In 2011, for comparison purposes, we adjust our historical
2010 results to include ACS’s 2010 estimated results for the period from
January 1 through February 5, 2010. In 2010, for comparison purposes, we
adjust our historical 2009 results to include ACS’s 2009 estimated results
for the period from February 6 through December 31, 2009. We believe
these pro-forma comparisons provide a perspective on the impact of the
ACS acquisition on our results and trends.
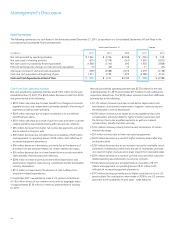
Costs, Expenses and Other Income
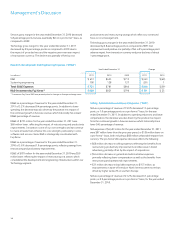
Summary of Key Financial Ratios
Year Ended December 31, Change Pro-forma(1)
2011 2010 2009 2011 2010 2011 2010
Total Gross Margin 32.8% 34.4% 39.7% (1.6) pts (5.3) pts (1.1) pts (0.2) pts
RD&E as a % of Revenue 3.2% 3.6% 5.5% (0.4) pts (1.9) pts (0.3) pts (0.4) pts
SAG as a % of Revenue 19.9% 21.2% 27.3% (1.3) pts (6.1) pts (1.0) pts (0.9) pts
Operating Margin(3) 9.8% 9.6% 6.8% 0.2 pts 2.8 pts 0.3 pts 1.0 pts
Pre-tax Income Margin 6.9% 3.8% 4.1% 3.1 pts (0.3) pts 3.4 pts (2.2) pts