Xerox 2011 Annual Report Download - page 39
Download and view the complete annual report
Please find page 39 of the 2011 Xerox annual report below. You can navigate through the pages in the report by either clicking on the pages listed below, or by using the keyword search tool below to find specific information within the annual report.-
 1
1 -
2
-
3
-
4
-
5
-
6
-
7
-
8
-
9
-
10
-
11
-
12
-
13
-
14
-
15
-
16
-
17
-
18
-
19
-
20
-
21
-
22
-
23
-
24
-
25
-
26
-
27
-
28
-
 29
29 -
 30
30 -
 31
31 -
 32
32 -
 33
33 -
 34
34 -
 35
35 -
 36
36 -
 37
37 -
 38
38 -
 39
39 -
 40
40 -
 41
41 -
 42
42 -
 43
43 -
 44
44 -
 45
45 -
 46
46 -
 47
47 -
 48
48 -
 49
49 -
50
-
51
-
52
-
53
-
54
-
55
-
56
-
57
-
58
-
59
-
60
-
61
-
62
-
63
-
64
-
65
-
66
-
67
-
68
-
69
-
70
-
71
-
72
-
73
-
74
-
75
-
76
-
77
-
78
-
79
-
80
-
81
-
82
-
83
-
84
-
85
-
86
-
87
-
88
-
89
-
90
-
91
-
92
-
93
-
94
-
95
-
96
-
97
-
98
-
99
-
100
-
101
-
102
-
103
-
104
-
105
-
106
-
107
-
108
-
109
-
110
-
111
-
112
-
113
-
114
-
115
-
116
 |
 |
Management’s Discussion
37Xerox 2011 Annual Report
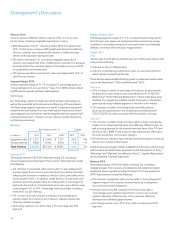
During the year ended December 31, 2010, we recorded $483 million
of net restructuring and asset impairment charges, which included
the following:
•$470 million of severance costs related to headcount reductions of
approximately 9,000 employees. The costs associated with these
actions applied about equally to North America and Europe, with
approximately 20% related to our developing market countries.
Approximately 50% of the costs were focused on gross margin
improvements, 40% on SAG and 10% on the optimization of RD&E
investments and impacted the following functional areas:
– Services
– Supply chain and manufacturing
– Back-office administration
– Development and engineering.
•$28 million for lease termination costs primarily reflecting the
continued rationalization and optimization of our worldwide operating
locations, including consolidations with ACS.
•$19 million loss associated with the sale of our Venezuelan subsidiary.
The loss primarily reflects the write-off our Venezuelan net assets
including working capital and long-lived assets. We continue to sell
equipment, parts and supplies to the acquiring company through
a distribution arrangement but no longer have any direct or local
operations in Venezuela.
•The above charges were partially offset by $41 million of net reversals
for changes in estimated reserves from prior-period initiatives.
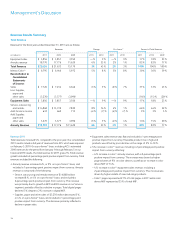
Restructuring Summary
The restructuring reserve balance as of December 31, 2011 for all
programs was $123 million, of which approximately $116 million
is expected to be spent over the next 12 months. Refer to Note 9 –
Restructuring and Asset Impairment Charges in the Consolidated
Financial Statements for additional information regarding our
restructuring programs.
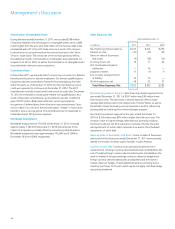
Acquisition-Related Costs
Costs of $77 million were incurred during 2010 in connection with
our acquisition of ACS. These costs include $53 million of transaction
costs, which represent external costs directly related to completing
the acquisition of ACS. The remainder of the acquisition-related costs
represents external incremental costs directly related to the integration of
ACS and Xerox.
Costs of $72 million were incurred during 2009 in connection with our
acquisition of ACS. $58 million of the costs relate to the write-off of fees
associated with a Bridge Loan Facility commitment which was terminated
as a result of securing permanent financing to fund the acquisition. The
remainder of the costs represent transaction costs such as banking, legal
and accounting fees, as well as some pre-integration costs such as external
consulting services.
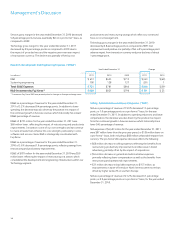
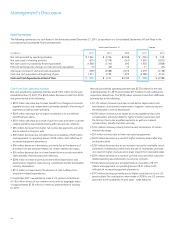
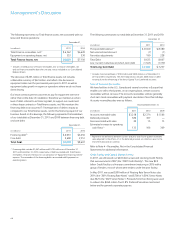
SAG expenses of $4,594 million for the year ended December 31, 2010
were $445 million higher than 2009, or $57 million lower on a pro-forma(1)
basis, including a negligible impact from currency. The pro-forma SAG
decrease reflects the following:
•$137 million increase in selling expenses, reflecting increased demand
generation and brand advertising and higher commissions, partially
offset by restructuring savings and productivity improvements
•$86 million decrease in general and administrative expenses, reflecting
benefits from restructuring and operational improvements
•$108 million decrease in bad debt expense, to $188 million, reflecting
an improved write-off trend.
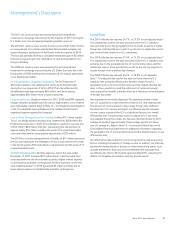
Restructuring and Asset Impairment Charges
During the year ended December 31, 2011, we recorded net restructuring
and asset impairment charges of $33 million ($18 million after-tax), which
included the following:
•$98 million of severance costs related to headcount reductions of
approximately 3,900 employees, primarily in North America. The
actions impacted several functional areas, and approximately 55%
of the costs were focused on gross margin improvements, 36% on
SAG and 9% on the optimization of RD&E investments.
•$1 million for lease termination costs.
•$5 million of asset impairment losses from the disposition of two
aircraft associated with the restructuring of our corporate aviation
operations.
•The above charges were partially offset by $71 million of net reversals
for changes in estimated reserves from prior period initiatives.
We expect 2012 pre-tax savings of approximately $60 million from our
2011 restructuring actions.
To date we have identified and approved additional restructuring
initiatives of approximately $25 million for the first quarter of 2012.
These actions are expected to impact all geographies and segments,
with approximately equal focus on SAG reductions, gross margin
improvements and optimization of RD&E investments.