Xerox 2011 Annual Report Download - page 85
Download and view the complete annual report
Please find page 85 of the 2011 Xerox annual report below. You can navigate through the pages in the report by either clicking on the pages listed below, or by using the keyword search tool below to find specific information within the annual report.-
 1
1 -
2
-
3
-
4
-
5
-
6
-
7
-
8
-
9
-
10
-
11
-
12
-
13
-
14
-
15
-
16
-
17
-
18
-
19
-
20
-
21
-
22
-
23
-
24
-
25
-
26
-
27
-
28
-
29
-
30
-
31
-
32
-
33
-
34
-
35
-
36
-
37
-
38
-
39
-
40
-
41
-
42
-
43
-
44
-
45
-
46
-
47
-
48
-
49
-
50
-
51
-
52
-
53
-
54
-
55
-
56
-
57
-
58
-
59
-
60
-
61
-
62
-
63
-
64
-
65
-
66
-
67
-
68
-
69
-
70
-
71
-
72
-
73
-
74
-
 75
75 -
 76
76 -
 77
77 -
 78
78 -
 79
79 -
 80
80 -
 81
81 -
 82
82 -
 83
83 -
 84
84 -
 85
85 -
 86
86 -
 87
87 -
 88
88 -
 89
89 -
 90
90 -
 91
91 -
 92
92 -
 93
93 -
 94
94 -
 95
95 -
96
-
97
-
98
-
99
-
100
-
101
-
102
-
103
-
104
-
105
-
106
-
107
-
108
-
109
-
110
-
111
-
112
-
113
-
114
-
115
-
116
 |
 |

83Xerox 2011 Annual Report
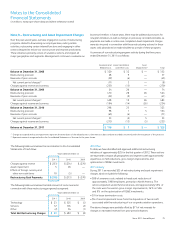
Foreign Exchange Risk Management
As a global company, we are exposed to foreign currency exchange rate
fluctuations in the normal course of our business. As a part of our foreign
exchange risk management strategy, we use derivative instruments –
primarily forward contracts and purchase option contracts – to hedge
the following foreign currency exposures, thereby reducing volatility of
earnings or protecting fair values of assets and liabilities:
•Foreign currency-denominated assets and liabilities
•Forecasted purchases and sales in foreign currency.
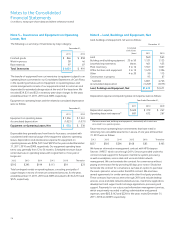
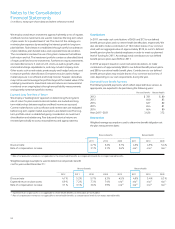
SummaryofForeignExchangeHedgingPositions:At December 31,
2011, we had outstanding forward exchange and purchased option
contracts with gross notional values of $3,444, which is typical of the
amounts that are normally outstanding at any point during the year.
These contracts generally mature in 12 months or less.
The following is a summary of the primary hedging positions and
corresponding fair values as of December 31, 2011:
Gross Fair Value
Notional Asset
Currencies Hedged (Buy/Sell) Value (Liability)(1)
Japanese Yen/U.S. Dollar $ 634 $ 5
U.S. Dollar/Euro 563 17
Japanese Yen/Euro 450 24
Euro/U.K. Pound Sterling 406 (5)
U.K. Pound Sterling/Euro 244 2
U.K. Pound Sterling/U.S. Dollar 217 (8)
Swiss Franc/Euro 172 2
Canadian Dollar/Euro 168 (1)
U.S. Dollar/Japanese Yen 94 —
Swedish Krona/Euro 86 2
Mexican Peso/U.S. Dollar 60 (5)
Indian Rupee/U.S. Dollar 47 (5)
All Other 303 (1)
Total Foreign Exchange Hedging $ 3,444 $ 27
(1) Represents the net receivable (payable) amount included in the Consolidated Balance
Sheet at December 31, 2011.
ForeignCurrencyCashFlowHedges: We designate a portion of our
foreign currency derivative contracts as cash flow hedges of our foreign
currency-denominated inventory purchases, sales and expenses. No
amount of ineffectiveness was recorded in the Consolidated Statements
of Income for these designated cash flow hedges and all components of
each derivative’s gain or loss was included in the assessment of hedge
effectiveness. The net asset fair value of these contracts was $26 and $18
as of December 31, 2011 and December 31, 2010, respectively.
Note 12 – Financial Instruments
We are exposed to market risk from changes in foreign currency exchange
rates and interest rates, which could affect operating results, financial
position and cash flows. We manage our exposure to these market
risks through our regular operating and financing activities and, when
appropriate, through the use of derivative financial instruments. These
derivative financial instruments are utilized to hedge economic exposures,
as well as to reduce earnings and cash flow volatility resulting from shifts in
market rates. We enter into limited types of derivative contracts, including
interest rate swap agreements, foreign currency spot, forward and swap
contracts and net purchased foreign currency options to manage interest
rate and foreign currency exposures. Our primary foreign currency market
exposures include the Japanese Yen, Euro and U.K. Pound Sterling. The
fair market values of all our derivative contracts change with fluctuations
in interest rates and/or currency exchange rates and are designed so that
any changes in their values are offset by changes in the values of the
underlying exposures. Derivative financial instruments are held solely as
risk management tools and not for trading or speculative purposes. The
related cash flow impacts of all of our derivative activities are reflected as
cash flows from operating activities.
We do not believe there is significant risk of loss in the event of non-
performance by the counterparties associated with our derivative
instruments because these transactions are executed with a diversified
group of major financial institutions. Further, our policy is to deal with
counterparties having a minimum investment-grade-or-better credit
rating. Credit risk is managed through the continuous monitoring of
exposures to such counterparties.
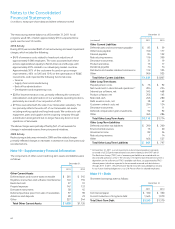
Interest Rate Risk Management
We use interest rate swap agreements to manage our interest rate
exposure and to achieve a desired proportion of variable and fixed rate
debt. These derivatives may be designated as fair value hedges or cash
flow hedges depending on the nature of the risk being hedged.
FairValueHedges: At December 31, 2011, we did not have any interest
rate swaps outstanding. At December 31, 2010, pay variable/receive fixed
interest rate swaps, with notional amounts of $950 and net asset fair
values of $11, were designated and accounted for as fair value hedges.
The swaps were structured to hedge the fair value of related debt by
converting them from fixed rate instruments to variable rate instruments.
No ineffective portion was recorded to earnings during 2011 or 2010.
TerminatedSwaps: During the period from 2004 to 2011, we early-
terminated several interest rate swaps that were designated as fair
value hedges of certain debt instruments. The associated net fair value
adjustments to the debt instruments are being amortized to interest
expense over the remaining term of the related notes. In 2011, 2010 and
2009, the amortization of these fair value adjustments reduced interest
expense by $53, $28 and $17, respectively, and we expect to record a net
decrease in interest expense of $190 in future years through 2018.
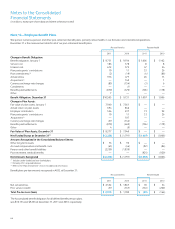
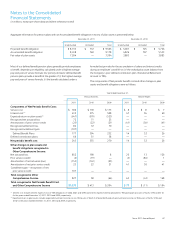
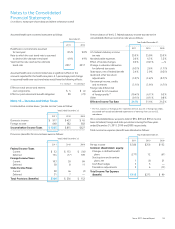
Notes to the Consolidated
Financial Statements
(in millions, except per-share data and where otherwise noted)