Xerox 2011 Annual Report Download - page 52
Download and view the complete annual report
Please find page 52 of the 2011 Xerox annual report below. You can navigate through the pages in the report by either clicking on the pages listed below, or by using the keyword search tool below to find specific information within the annual report.-
 1
1 -
2
-
3
-
4
-
5
-
6
-
7
-
8
-
9
-
10
-
11
-
12
-
13
-
14
-
15
-
16
-
17
-
18
-
19
-
20
-
21
-
22
-
23
-
24
-
25
-
26
-
27
-
28
-
29
-
30
-
31
-
32
-
33
-
34
-
35
-
36
-
37
-
38
-
39
-
40
-
41
-
 42
42 -
 43
43 -
 44
44 -
 45
45 -
 46
46 -
 47
47 -
 48
48 -
 49
49 -
 50
50 -
 51
51 -
 52
52 -
 53
53 -
 54
54 -
 55
55 -
 56
56 -
 57
57 -
 58
58 -
 59
59 -
 60
60 -
 61
61 -
 62
62 -
63
-
64
-
65
-
66
-
67
-
68
-
69
-
70
-
71
-
72
-
73
-
74
-
75
-
76
-
77
-
78
-
79
-
80
-
81
-
82
-
83
-
84
-
85
-
86
-
87
-
88
-
89
-
90
-
91
-
92
-
93
-
94
-
95
-
96
-
97
-
98
-
99
-
100
-
101
-
102
-
103
-
104
-
105
-
106
-
107
-
108
-
109
-
110
-
111
-
112
-
113
-
114
-
115
-
116
 |
 |
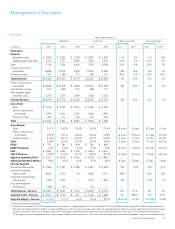
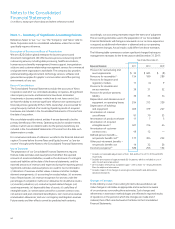
Management’s Discussion
50
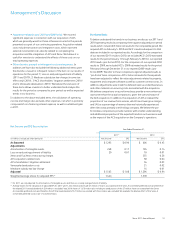
Management believes that these non-GAAP financial measures provide
an additional means of analyzing the current periods’ results against the
corresponding prior periods’ results. However, these non-GAAP financial
measures should be viewed in addition to, and not as a substitute for,
the Company’s reported results prepared in accordance with GAAP. Our
non-GAAP financial measures are not meant to be considered in isolation
or as a substitute for comparable GAAP measures and should be read only
in conjunction with our consolidated financial statements prepared in
accordance with GAAP. Our management regularly uses our supplemental
non-GAAP financial measures internally to understand, manage and
evaluate our business and make operating decisions. These non-GAAP
measures are among the primary factors management uses in planning
for and forecasting future periods. Compensation of our executives is
based in part on the performance of our business based on these non-
GAAP measures.
A reconciliation of these non-GAAP financial measures and the most
directly comparable measures calculated and presented in accordance
with GAAP are set forth on the following tables.
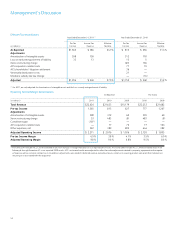
Adjusted Earnings Measures
To better understand the trends in our business and the impact of the
ACS acquisition, we believe it is necessary to adjust the following amounts
determined in accordance with GAAP to exclude the effects of the certain
items as well as their related income tax effects. For our 2011 reporting
year, adjustments were limited to the amortization of intangible assets
and the loss on early extinguishment of liability.
•Net income and Earnings per share (“EPS”),
•Effective tax rate, and
•Pre-tax income(loss) margin.
The above have been adjusted for the following items:
•Amortizationofintangibleassets(allperiods):The amortization
of intangible assets is driven by our acquisition activity which can
vary in size, nature and timing as compared to other companies
within our industry and from period to period. Accordingly, due to
the incomparability of acquisition activity among companies and
from period to period, we believe exclusion of the amortization
associated with intangible assets acquired through our acquisitions
allows investors to better compare and understand our results. The
use of intangible assets contributed to our revenues earned during the
periods presented and will contribute to our future-period revenues as
well. Amortization of intangible assets will recur in future periods.
•Restructuringandassetimpairmentcharges(includingthose
incurredbyFujiXerox)(2010and2009only): Restructuring and asset
impairment charges consist of costs primarily related to severance and
benefits for employees terminated pursuant to formal restructuring
and workforce reduction plans. We exclude these charges because
we believe that these historical costs do not reflect expected future
operating expenses and do not contribute to a meaningful evaluation
of our current or past operating performance. In addition, such
charges are inconsistent in amount and frequency. Such charges
are expected to yield future benefits and savings with respect to our
operational performance.
Financial Risk Management
We are exposed to market risk from foreign currency exchange rates and
interest rates, which could affect operating results, financial position and
cash flows. We manage our exposure to these market risks through our
regular operating and financing activities and, when appropriate, through
the use of derivative financial instruments. We utilized derivative financial
instruments to hedge economic exposures, as well as reduce earnings and
cash flow volatility resulting from shifts in market rates.
Recent market events have not caused us to materially modify or change
our financial risk management strategies with respect to our exposures
to interest rate and foreign currency risk. Refer to Note 12 – Financial
Instruments in the Consolidated Financial Statements for additional
discussion on our financial risk management.
Foreign Exchange Risk Management
Assuming a 10% appreciation or depreciation in foreign currency
exchange rates from the quoted foreign currency exchange rates at
December 31, 2011, the potential change in the fair value of foreign
currency-denominated assets and liabilities in each entity would
not be significant because all material currency asset and liability
exposures were economically hedged as of December 31, 2011. A 10%
appreciation or depreciation of the U.S. Dollar against all currencies
from the quoted foreign currency exchange rates at December 31, 2011
would have an impact on our cumulative translation adjustment portion
of equity of approximately $740 million. The net amount invested in
foreign subsidiaries and affiliates, primarily Xerox Limited, Fuji Xerox,
Xerox Canada Inc. and Xerox Brasil, and translated into U.S. Dollars
using the year-end exchange rates, was approximately $7.4 billion at
December 31, 2011.
Interest Rate Risk Management
The consolidated weighted-average interest rates related to our total
debt for 2011, 2010 and 2009 approximated 5.2%, 5.8%, and 6.1%,
respectively. Interest expense includes the impact of our interest rate
derivatives.
Virtually all customer-financing assets earn fixed rates of interest.
The interest rates on a significant portion of the Company’s term debt
are fixed.
As of December 31, 2011, $302 million of our total debt carried variable
interest rates, including the effect of pay variable interest rate swaps we
use to reduce the effective interest rate on our fixed coupon debt.
The fair market values of our fixed-rate financial instruments are sensitive
to changes in interest rates. At December 31, 2011, a 10% change
in market interest rates would change the fair values of such financial
instruments by approximately $160 million.
Non-GAAP Financial Measures
We have reported our financial results in accordance with generally
accepted accounting principles (“GAAP”). In addition, we have discussed
our results using non-GAAP measures.