Xerox 2011 Annual Report Download - page 77
Download and view the complete annual report
Please find page 77 of the 2011 Xerox annual report below. You can navigate through the pages in the report by either clicking on the pages listed below, or by using the keyword search tool below to find specific information within the annual report.-
 1
1 -
2
-
3
-
4
-
5
-
6
-
7
-
8
-
9
-
10
-
11
-
12
-
13
-
14
-
15
-
16
-
17
-
18
-
19
-
20
-
21
-
22
-
23
-
24
-
25
-
26
-
27
-
28
-
29
-
30
-
31
-
32
-
33
-
34
-
35
-
36
-
37
-
38
-
39
-
40
-
41
-
42
-
43
-
44
-
45
-
46
-
47
-
48
-
49
-
50
-
51
-
52
-
53
-
54
-
55
-
56
-
57
-
58
-
59
-
60
-
61
-
62
-
63
-
64
-
65
-
66
-
 67
67 -
 68
68 -
 69
69 -
 70
70 -
 71
71 -
 72
72 -
 73
73 -
 74
74 -
 75
75 -
 76
76 -
 77
77 -
 78
78 -
 79
79 -
 80
80 -
 81
81 -
 82
82 -
 83
83 -
 84
84 -
 85
85 -
 86
86 -
 87
87 -
88
-
89
-
90
-
91
-
92
-
93
-
94
-
95
-
96
-
97
-
98
-
99
-
100
-
101
-
102
-
103
-
104
-
105
-
106
-
107
-
108
-
109
-
110
-
111
-
112
-
113
-
114
-
115
-
116
 |
 |

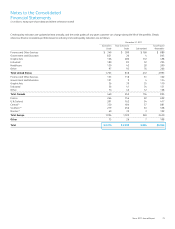
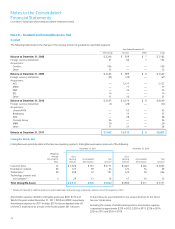
75Xerox 2011 Annual Report
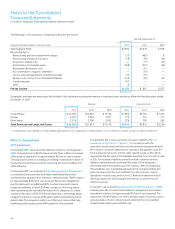
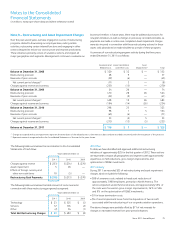
The aging of our billed finance receivables is as follows:
December 31, 2011
Finance
Total Billed Unbilled Total Receivables
31–90 Days >90 Days Finance Finance Finance >90 Days
Current Past Due Past Due Receivables Receivables Receivables and Accruing
Finance and Other Services $ 18 $ 4 $ 1 $ 23 $ 866 $ 889 $ 15
Government and Education 21 5 2 28 817 845 29
Graphic Arts 16 2 1 19 479 498 7
Industrial 7 2 1 10 285 295 6
Healthcare 5 2 — 7 193 200 5
Other 8 1 — 9 257 266 4
Total United States 75 16 5 96 2,897 2,993 66
Canada 3 2 1 6 819 825 27
France 1 1 1 3 689 692 16
U.K./Ireland 3 2 3 8 409 417 4
Central(1) 7 2 3 12 869 881 46
Southern(2) 31 4 13 48 490 538 82
Nordics(3) 1 — — 1 101 102 —
Total Europe 43 9 20 72 2,558 2,630 148
Other 2 1 — 3 105 108 —
Total $ 123 $ 28 $ 26 $ 177 $ 6,379 $ 6,556 $ 241
December 31, 2010
Finance
Total Billed Unbilled Total Receivables
31–90 Days >90 Days Finance Finance Finance >90 Days
Current Past Due Past Due Receivables Receivables Receivables and Accruing
Finance and Other Services $ 23 $ 5 $ 2 $ 30 $ 921 $ 951 $ 23
Government and Education 26 6 3 35 842 877 40
Graphic Arts 21 3 1 25 495 520 16
Industrial 11 2 1 14 321 335 10
Healthcare 6 2 1 9 205 214 9
Other 8 2 — 10 270 280 8
Total United States 95 20 8 123 3,054 3,177 106
Canada 3 3 1 7 865 872 28
France 1 1 — 2 673 675 5
U.K./Ireland 4 1 1 6 415 421 7
Central(1) 9 2 4 15 898 913 39
Southern(2) 32 10 15 57 524 581 99
Nordics(3) 1 — — 1 115 116 2
Total Europe 47 14 20 81 2,625 2,706 152
Other 2 — — 2 64 66 —
Total $ 147 $ 37 $ 29 $ 213 $ 6,608 $ 6,821 $ 286
(1) Switzerland, Germany, Austria, Belgium and Holland.
(2) Italy, Greece, Spain and Portugal.
(3) Sweden, Norway, Denmark and Finland.
Notes to the Consolidated
Financial Statements
(in millions, except per-share data and where otherwise noted)