Xerox 2011 Annual Report Download - page 36
Download and view the complete annual report
Please find page 36 of the 2011 Xerox annual report below. You can navigate through the pages in the report by either clicking on the pages listed below, or by using the keyword search tool below to find specific information within the annual report.-
 1
1 -
2
-
3
-
4
-
5
-
6
-
7
-
8
-
9
-
10
-
11
-
12
-
13
-
14
-
15
-
16
-
17
-
18
-
19
-
20
-
21
-
22
-
23
-
24
-
25
-
 26
26 -
 27
27 -
 28
28 -
 29
29 -
 30
30 -
 31
31 -
 32
32 -
 33
33 -
 34
34 -
 35
35 -
 36
36 -
 37
37 -
 38
38 -
 39
39 -
 40
40 -
 41
41 -
 42
42 -
 43
43 -
 44
44 -
 45
45 -
 46
46 -
47
-
48
-
49
-
50
-
51
-
52
-
53
-
54
-
55
-
56
-
57
-
58
-
59
-
60
-
61
-
62
-
63
-
64
-
65
-
66
-
67
-
68
-
69
-
70
-
71
-
72
-
73
-
74
-
75
-
76
-
77
-
78
-
79
-
80
-
81
-
82
-
83
-
84
-
85
-
86
-
87
-
88
-
89
-
90
-
91
-
92
-
93
-
94
-
95
-
96
-
97
-
98
-
99
-
100
-
101
-
102
-
103
-
104
-
105
-
106
-
107
-
108
-
109
-
110
-
111
-
112
-
113
-
114
-
115
-
116
 |
 |

Management’s Discussion
34
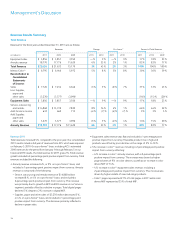
Revenue Results Summary
Total Revenue
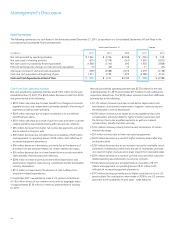
Revenue for the three years ended December 31, 2011 was as follows:
Revenues Change Pro-forma(1) Percent of Total Revenue
(in millions) 2011 2010 2009 2011 2010 2011 2010 2011 2010 2009
Equipment sales $ 3,856 $ 3,857 3,550 —% 9% —% 9% 17% 18% 23%
Annuity revenue 18,770 17,776 11,629 6% 53% 2% 1% 83% 82% 77%
Total Revenue $ 22,626 $ 21,633 15,179 5% 43% 2% 3% 100% 100% 100%
Memo: Color(2) $ 6,795 $ 6,446 5,972 5% 8% 5% 8% 30% 30% 39%
Reconciliation to
Consolidated
Statements
of Income:
Sales $ 7,126 $ 7,234 6,646 (1)% 9% (2)% 7% 31% 33% 43%
Less: Supplies,
paper and
other sales (3,270) (3,377) (3,096) (14)% (15)% (20)%
Equipment Sales $ 3,856 $ 3,857 3,550 —% 9% —% 9% 17% 18% 23%
Service, outsourcing
and rentals $ 14,868 $ 13,739 7,820 8% 76% 4% 1% 66% 64% 52%
Add: Finance income 632 660 713 (4)% (7)% (4)% (7)% 3% 3% 5%
Add: Supplies,
paper and
other sales 3,270 3,377 3,096 (3)% 9% (4)% 4% 14% 15% 20%
Annuity Revenue $ 18,770 $ 17,776 $ 11,629 6% 53% 2% 1% 83% 82% 77%
Revenue2011
Total revenues increased 5% compared to the prior year. Our consolidated
2011 results include a full year of revenues from ACS, which was acquired
on February 5, 2010. On a pro-forma(1) basis, including ACS’s estimated
2010 revenues for the period from January 1 through February 5 in our
historical 2010 results, the total revenue for 2011 grew 2%. Total revenue
growth included a 2-percentage point positive impact from currency. Total
revenues included the following:
•Annuity revenue increased 6%, or 2% on a pro-forma(1) basis, and
included a 1-percentage point positive impact from currency. Annuity
revenue is comprised of the following:
– Service, outsourcing and rentals revenue of $14,868 million
increased 8%, or 4% on a pro-forma(1) basis, and included a
2-percentage point positive impact from currency. The increase
was primarily due to growth in BPO and DO revenue in our Services
segment, partially offset by a decline in pages. Total digital pages
declined 3% despite a 2% increase in digital MIF.
– Supplies, paper and other sales of $3,270 million decreased 3%,
or 4% on a pro-forma(1) basis, and included a 1-percentage point
positive impact from currency. The decrease primarily reflected a
decline in paper sales.
•Equipment sales revenue was flat and included a 1-percentage point
positive impact from currency. Favorable product mix in high-end
products was offset by price declines in the range of 5% to 10%.
•5% increase in color(2) revenue, including a 2-percentage point positive
impact from currency reflecting:
– 6% increase in color(2) annuity revenue, with a 2-percentage point
positive impact from currency. The increase was driven by higher
page volumes of 9% on color devices, as well as an increase in color
device MIF of 14%.
– 4% increase in color(2) equipment sales revenue, including a
2-percentage point positive impact from currency. This increase was
driven by higher installs of new mid-range products.
– Color(2) pages represented 27% of total pages in 2011 while color
device MIF represented 35% of total MIF.