Xerox 2011 Annual Report Download - page 48
Download and view the complete annual report
Please find page 48 of the 2011 Xerox annual report below. You can navigate through the pages in the report by either clicking on the pages listed below, or by using the keyword search tool below to find specific information within the annual report.-
 1
1 -
2
-
3
-
4
-
5
-
6
-
7
-
8
-
9
-
10
-
11
-
12
-
13
-
14
-
15
-
16
-
17
-
18
-
19
-
20
-
21
-
22
-
23
-
24
-
25
-
26
-
27
-
28
-
29
-
30
-
31
-
32
-
33
-
34
-
35
-
36
-
37
-
 38
38 -
 39
39 -
 40
40 -
 41
41 -
 42
42 -
 43
43 -
 44
44 -
 45
45 -
 46
46 -
 47
47 -
 48
48 -
 49
49 -
 50
50 -
 51
51 -
 52
52 -
 53
53 -
 54
54 -
 55
55 -
 56
56 -
 57
57 -
 58
58 -
59
-
60
-
61
-
62
-
63
-
64
-
65
-
66
-
67
-
68
-
69
-
70
-
71
-
72
-
73
-
74
-
75
-
76
-
77
-
78
-
79
-
80
-
81
-
82
-
83
-
84
-
85
-
86
-
87
-
88
-
89
-
90
-
91
-
92
-
93
-
94
-
95
-
96
-
97
-
98
-
99
-
100
-
101
-
102
-
103
-
104
-
105
-
106
-
107
-
108
-
109
-
110
-
111
-
112
-
113
-
114
-
115
-
116
 |
 |
Management’s Discussion
46
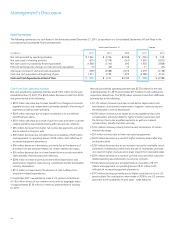
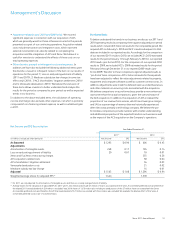
The following represents our Total finance assets, net associated with our
lease and finance operations:
December 31,
(in millions) 2011 2010
Total Finance receivables, net(1) $ 6,362 $ 6,620
Equipment on operating leases, net 533 530
Total Finance Assets, net $ 6,895 $ 7,150
(1) Includes (i) billed portion of finance receivables, net, (ii) finance receivables, net
and (iii) finance receivables due after one year, net as included in our Consolidated
Balance Sheets.
The decrease of $255 million in Total finance assets, net includes
unfavorable currency of $63 million, and reflects the decrease in
equipment sales over the past several years prior to 2011 as well as
equipment sales growth in regions or operations where we do not have
direct leasing.
Our lease contracts permit customers to pay for equipment over time
rather than at the date of installation; therefore, we maintain a certain
level of debt, referred to as financing debt, to support our investment
in these lease contracts or Total finance assets, net. We maintain this
financing debt at an assumed 7:1 leverage ratio of debt to equity as
compared to our Total finance assets, net for this financing aspect of our
business. Based on this leverage, the following represents the breakdown
of our total debt at December 31, 2011 and 2010 between financing debt
and core debt:
December 31,
(in millions) 2011 2010
Financing debt(1) $ 6,033 $ 6,256
Core debt 2,600 2,351
Total Debt $ 8,633 $ 8,607
(1) Financing debt includes $5,567 million and $5,793 million as of December 31,
2011 and December 31, 2010, respectively, of debt associated with Total finance
receivables, net and is the basis for our calculation of “Equipment financing interest”
expense. The remainder of the financing debt is associated with Equipment on
operating leases.
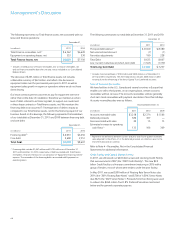
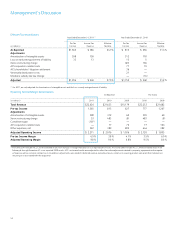
The following summarizes our total debt at December 31, 2011 and 2010:
December 31,
(in millions) 2011 2010
Principal debt balance(1) $ 8,450 $ 8,380
Net unamortized discount (7) (1)
Fair value adjustments 190 228
Total Debt 8,633 8,607
Less: Current maturities and short-term debt (1,545) (1,370)
Total Long-Term Debt $ 7,088 $ 7,237
(1) Includes Commercial Paper of $100 million and $300 million as of December 31,
2011 and 2010, respectively. The 2011 balance also includes $650 million in debt
resulting from the refinancing of the Xerox Capital Trust I preferred securities.
SalesofAccountsReceivable
We have facilities in the U.S., Canada and several countries in Europe that
enable us to sell to third parties, on an ongoing basis, certain accounts
receivables without recourse. The accounts receivables sold are generally
short-term trade receivables with payment due dates of less than 60 days.
Accounts receivables sales were as follows:
Year Ended December 31,
(in millions) 2011 2010 2009
Accounts receivable sales $ 3,218 $ 2,374 $ 1,566
Deferred proceeds 386 307 —
Fees associated with sales 20 15 13
Estimated increase to operating
cash flows(1) 133 106 309
(1) Represents the difference between current- and prior-year fourth-quarter receivable
sales adjusted for the effects of: (i) the deferred proceeds, (ii) collections prior to the
end of the year and (iii) currency.
Refer to Note 4 – Receivables, Net in the Consolidated Financial
Statements for additional information.
CreditFacilityandCapitalMarketActivity
In 2011, we refinanced our $2.0 billion unsecured revolving Credit Facility
that was executed in 2007 (the “2007 Credit Facility”). This new $2.0
billion Credit Facility is a five-year commitment maturing in 2016 with a
group of lenders, most of whom were lenders under the prior facility.
In May 2011, we issued $300 million of Floating Rate Senior Notes due
2014 (the “2014 Floating Rate Notes”) and $700 of 4.50% Senior Notes
due 2021 (the “2021 Senior Notes”). Proceeds from the offering were used
to redeem the $650 million Trust I 8% Preferred Securities mentioned
below and for general corporate purposes.