Xerox 2011 Annual Report Download - page 94
Download and view the complete annual report
Please find page 94 of the 2011 Xerox annual report below. You can navigate through the pages in the report by either clicking on the pages listed below, or by using the keyword search tool below to find specific information within the annual report.-
 1
1 -
2
-
3
-
4
-
5
-
6
-
7
-
8
-
9
-
10
-
11
-
12
-
13
-
14
-
15
-
16
-
17
-
18
-
19
-
20
-
21
-
22
-
23
-
24
-
25
-
26
-
27
-
28
-
29
-
30
-
31
-
32
-
33
-
34
-
35
-
36
-
37
-
38
-
39
-
40
-
41
-
42
-
43
-
44
-
45
-
46
-
47
-
48
-
49
-
50
-
51
-
52
-
53
-
54
-
55
-
56
-
57
-
58
-
59
-
60
-
61
-
62
-
63
-
64
-
65
-
66
-
67
-
68
-
69
-
70
-
71
-
72
-
73
-
74
-
75
-
76
-
77
-
78
-
79
-
80
-
81
-
82
-
83
-
 84
84 -
 85
85 -
 86
86 -
 87
87 -
 88
88 -
 89
89 -
 90
90 -
 91
91 -
 92
92 -
 93
93 -
 94
94 -
 95
95 -
 96
96 -
 97
97 -
 98
98 -
 99
99 -
 100
100 -
 101
101 -
 102
102 -
 103
103 -
 104
104 -
105
-
106
-
107
-
108
-
109
-
110
-
111
-
112
-
113
-
114
-
115
-
116
 |
 |

92
We employ a total return investment approach whereby a mix of equities
and fixed-income investments are used to maximize the long-term return
of plan assets for a prudent level of risk. The intent of this strategy is to
minimize plan expenses by exceeding the interest growth in long-term
plan liabilities. Risk tolerance is established through careful consideration
of plan liabilities, plan funded status and corporate financial condition.
This consideration involves the use of long-term measures that address
both return and risk. The investment portfolio contains a diversified blend
of equity and fixed-income investments. Furthermore, equity investments
are diversified across U.S. and non-U.S. stocks, as well as growth, value
and small and large capitalizations, and may include Company stock.
Other assets such as real estate, private equity and hedge funds are used
to improve portfolio diversification. Derivatives may be used to hedge
market exposure in an efficient and timely manner; however, derivatives
may not be used to leverage the portfolio beyond the market value of the
underlying investments. Investment risks and returns are measured and
monitored on an ongoing basis through annual liability measurements
and quarterly investment portfolio reviews.
ExpectedLong-TermRateofReturn
We employ a “building block” approach in determining the long-term
rate of return for plan assets. Historical markets are studied and long-
term relationships between equities and fixed income are assessed.
Current market factors such as inflation and interest rates are evaluated
before long-term capital market assumptions are determined. The long-
term portfolio return is established giving consideration to investment
diversification and rebalancing. Peer data and historical returns are
reviewed periodically to assess reasonableness and appropriateness.
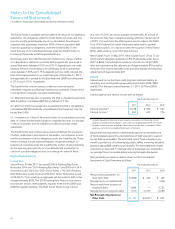
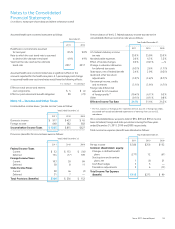
Contributions
In 2011, we made cash contributions of $426 and $73 to our defined
benefit pension plans and our retiree health benefit plans, respectively. We
also elected to make a contribution of 16.6 million shares of our common
stock, with an aggregate value of approximately $130, to our U.S. defined
benefit pension plan for salaried employees in order to meet our planned
level of funding for 2011. Accordingly, total contributions to our defined
benefit pension plans were $556 in 2011.
In 2012 we expect, based on current actuarial calculations, to make
contributions of approximately $560 to our defined benefit pension plans
and $80 to our retiree health benefit plans. Contributions to our defined
benefit pension plans may include shares of our common stock in lieu of
cash, depending on our cash requirements during the year.
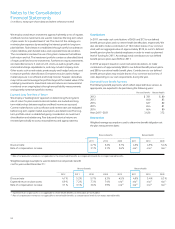
EstimatedFutureBenetPayments
The following benefit payments, which reflect expected future service, as
appropriate, are expected to be paid during the following years:
Pension Benefits Retiree Health
2012 $ 781 $ 80
2013 640 83
2014 627 82
2015 654 81
2016 664 80
Years 2017–2021 3,426 372
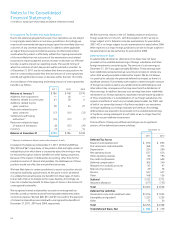
Assumptions
Weighted-average assumptions used to determine benefit obligations at
the plan measurement dates:
Pension Benefits Retiree Health
2011 2010 2009 2011 2010 2009
Discount rate 4.7% 5.2% 5.7% 4.5% 4.9% 5.4%
Rate of compensation increase 3.1% 3.1% 3.6% n/a(1) n/a(1) n/a(1)
(1) Rate of compensation increase is not applicable to the retiree health benefits, as compensation levels do not impact earned benefits.
Weighted-average assumptions used to determine net periodic benefit
cost for years ended December 31:
Pension Benefits Retiree Health
2012 2011 2010 2009 2012 2011 2010 2009
Discount rate 4.7% 5.2% 5.7% 6.3% 4.5% 4.9% 5.4% 6.3%
Expected return on plan assets 6.9% 7.2% 7.3% 7.4% n/a(1) n/a(1) n/a(1) n/a(1)
Rate of compensation increase 3.1% 3.1% 3.6% 3.9% n/a(2) n/a(2) n/a(2) n/a(2)
(1) Expected return on plan assets is not applicable to retiree health benefits, as these plans are not funded.
(2) Rate of compensation increase is not applicable to retiree health benefits, as compensation levels do not impact earned benefits.
Notes to the Consolidated
Financial Statements
(in millions, except per-share data and where otherwise noted)