Xerox 2011 Annual Report Download - page 89
Download and view the complete annual report
Please find page 89 of the 2011 Xerox annual report below. You can navigate through the pages in the report by either clicking on the pages listed below, or by using the keyword search tool below to find specific information within the annual report.-
 1
1 -
2
-
3
-
4
-
5
-
6
-
7
-
8
-
9
-
10
-
11
-
12
-
13
-
14
-
15
-
16
-
17
-
18
-
19
-
20
-
21
-
22
-
23
-
24
-
25
-
26
-
27
-
28
-
29
-
30
-
31
-
32
-
33
-
34
-
35
-
36
-
37
-
38
-
39
-
40
-
41
-
42
-
43
-
44
-
45
-
46
-
47
-
48
-
49
-
50
-
51
-
52
-
53
-
54
-
55
-
56
-
57
-
58
-
59
-
60
-
61
-
62
-
63
-
64
-
65
-
66
-
67
-
68
-
69
-
70
-
71
-
72
-
73
-
74
-
75
-
76
-
77
-
78
-
 79
79 -
 80
80 -
 81
81 -
 82
82 -
 83
83 -
 84
84 -
 85
85 -
 86
86 -
 87
87 -
 88
88 -
 89
89 -
 90
90 -
 91
91 -
 92
92 -
 93
93 -
 94
94 -
 95
95 -
 96
96 -
 97
97 -
 98
98 -
 99
99 -
100
-
101
-
102
-
103
-
104
-
105
-
106
-
107
-
108
-
109
-
110
-
111
-
112
-
113
-
114
-
115
-
116
 |
 |

87Xerox 2011 Annual Report
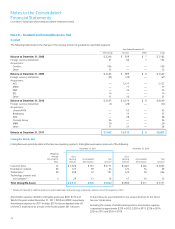
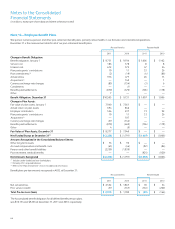
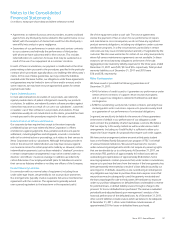
Aggregate information for pension plans with an Accumulated benefit obligation in excess of plan assets is presented below:
December 31, 2011 December 31, 2010
Underfunded Unfunded Total Underfunded Unfunded Total
Projected benefit obligation $ 8,733 $ 772 $ 9,505 $ 5,001 $ 725 $ 5,726
Accumulated benefit obligation 8,418 760 9,178 4,826 707 5,533
Fair value of plan assets 7,204 — 7,204 3,883 — 3,883
Year Ended December 31,
Pension Benefits Retiree Health
2011 2010 2009 2011 2010 2009
Components of Net Periodic Benefit Costs:
Service cost $ 186 $ 178 $ 173 $ 8 $ 8 $ 7
Interest cost(1) 612 575 508 47 54 60
Expected return on plan assets(2) (647) (570) (523) — — —
Recognized net actuarial loss 72 71 25 — — —
Amortization of prior service credit (23) (22) (21) (41) (30) (41)
Recognized settlement loss 84 72 70 — — —
Recognized curtailment gain (107) — — — — —
Defined Benefit Plans 177 304 232 14 32 26
Defined contribution plans 66 51 38 — — —
Net periodic benefit cost 243 355 270 14 32 26
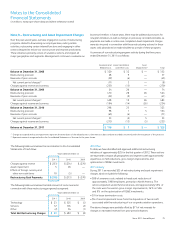
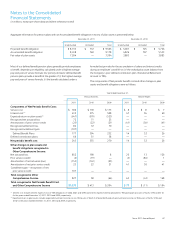
Other changes in plan assets and
benefit obligations recognized in
Other Comprehensive Income:
Net actuarial loss 852 198 8 25 13 126
Prior service (credit) (2) (19) — (3) (86) 1
Amortization of net actuarial (loss) (153) (143) (95) — — —
Amortization of net prior service credit 23 22 21 41 30 41
Curtailment gain – recognition of net
prior service credit 107 — — — — —
Total recognized in Other
Comprehensive Income 827 58 (66) 63 (43) 168
Total recognized in Net Periodic Benefit Cost
and Other Comprehensive Income $ 1,070 $ 413 $ 204 $ 77 $ (11) $ 194
(1) Interest cost includes interest expense on non-TRA obligations of $388, $381 and $390 and interest expense directly allocated to TRA participant accounts of $224, $194 and $118
for the years ended December 31, 2011, 2010 and 2009, respectively.
(2) Expected return on plan assets includes expected investment income on non-TRA assets of $423, $376 and $405 and actual investment income on TRA assets of $224, $194 and
$118 for the years ended December 31, 2011, 2010 and 2009, respectively.
Most of our defined benefit pension plans generally provide employees
a benefit, depending on eligibility, calculated under a highest average
pay and years of service formula. Our primary domestic defined benefit
pension plans provide a benefit at the greater of (i) the highest average
pay and years of service formula, (ii) the benefit calculated under a
formula that provides for the accumulation of salary and interest credits
during an employee’s work life or (iii) the individual account balance from
the Company’s prior defined contribution plan (Transitional Retirement
Account or TRA).
The components of Net periodic benefit cost and other changes in plan
assets and benefit obligations were as follows:
Notes to the Consolidated
Financial Statements
(in millions, except per-share data and where otherwise noted)