Xerox 2011 Annual Report Download - page 34
Download and view the complete annual report
Please find page 34 of the 2011 Xerox annual report below. You can navigate through the pages in the report by either clicking on the pages listed below, or by using the keyword search tool below to find specific information within the annual report.-
 1
1 -
2
-
3
-
4
-
5
-
6
-
7
-
8
-
9
-
10
-
11
-
12
-
13
-
14
-
15
-
16
-
17
-
18
-
19
-
20
-
21
-
22
-
23
-
 24
24 -
 25
25 -
 26
26 -
 27
27 -
 28
28 -
 29
29 -
 30
30 -
 31
31 -
 32
32 -
 33
33 -
 34
34 -
 35
35 -
 36
36 -
 37
37 -
 38
38 -
 39
39 -
 40
40 -
 41
41 -
 42
42 -
 43
43 -
 44
44 -
45
-
46
-
47
-
48
-
49
-
50
-
51
-
52
-
53
-
54
-
55
-
56
-
57
-
58
-
59
-
60
-
61
-
62
-
63
-
64
-
65
-
66
-
67
-
68
-
69
-
70
-
71
-
72
-
73
-
74
-
75
-
76
-
77
-
78
-
79
-
80
-
81
-
82
-
83
-
84
-
85
-
86
-
87
-
88
-
89
-
90
-
91
-
92
-
93
-
94
-
95
-
96
-
97
-
98
-
99
-
100
-
101
-
102
-
103
-
104
-
105
-
106
-
107
-
108
-
109
-
110
-
111
-
112
-
113
-
114
-
115
-
116
 |
 |

Management’s Discussion
32
Benefit plan costs are included in several income statement components
based on the related underlying employee costs. Pension and retiree
health benefit plan assumptions are included in Note 14 – Employee
Benefit Plans in the Consolidated Financial Statements.
Income Taxes
We record the estimated future tax effects of temporary differences
between the tax bases of assets and liabilities and amounts reported in
our Consolidated Balance Sheets, as well as operating loss and tax credit
carryforwards. We follow very specific and detailed guidelines in each
tax jurisdiction regarding the recoverability of any tax assets recorded in
our Consolidated Balance Sheets and provide valuation allowances as
required. We regularly review our deferred tax assets for recoverability
considering historical profitability, projected future taxable income, the
expected timing of the reversals of existing temporary differences and
tax planning strategies. If we continue to operate at a loss in certain
jurisdictions or are unable to generate sufficient future taxable income,
or if there is a material change in the actual effective tax rates or time
period within which the underlying temporary differences become taxable
or deductible, we could be required to increase the valuation allowance
against all or a significant portion of our deferred tax assets, resulting
in a substantial increase in our effective tax rate and a material adverse
impact on our operating results. Conversely, if and when our operations
in some jurisdictions become sufficiently profitable to recover previously
reserved deferred tax assets, we would reduce all or a portion of the
applicable valuation allowance in the period when such determination is
made. This would result in an increase to reported earnings in such period.
Adjustments to our valuation allowance, through (credits) charges to
income tax expense, were $(5) million, $22 million and $(11) million for
the years ended December 31, 2011, 2010 and 2009, respectively. There
were other (decreases) increases to our valuation allowance, including
the effects of currency, of $(53) million, $11 million and $55 million for
the years ended December 31, 2011, 2010 and 2009, respectively. These
did not affect income tax expense in total, as there was a corresponding
adjustment to deferred tax assets or other comprehensive income.
Gross deferred tax assets of $3.7 billion and $3.8 billion had valuation
allowances of $677 million and $735 million at December 31, 2011 and
2010, respectively.
We are subject to ongoing tax examinations and assessments in various
jurisdictions. Accordingly, we may incur additional tax expense based upon
our assessment of the more-likely-than-not outcomes of such matters. In
addition, when applicable, we adjust the previously recorded tax expense
to reflect examination results. Our ongoing assessments of the more-likely-
than-not outcomes of the examinations and related tax positions require
judgment and can materially increase or decrease our effective tax rate, as
well as impact our operating results. Unrecognized tax benefits were $225
million, $186 million and $148 million at December 31, 2011, 2010 and
2009, respectively.
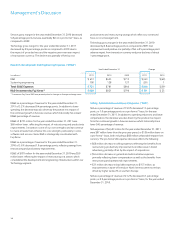
and the U.K., which comprise approximately 75% of our projected benefit
obligations, we consider the Moody’s Aa Corporate Bond Index and the
International Index Company’s iBoxx Sterling Corporate AA Cash Bond
Index, respectively, in the determination of the appropriate discount rate
assumptions. The weighted average discount rate we used to measure
our pension obligations as of December 31, 2011 and to calculate our
2012 expense was 4.7%, which is lower than the 5.2% that was used to
calculate our 2011 expense. The weighted average discount rate we used
to measure our retiree health obligation as of December 31, 2011 and to
calculate our 2012 expense was 4.5%, which is lower than the 4.9% that
was used to calculate our 2011 expense.
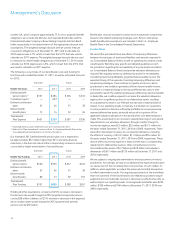
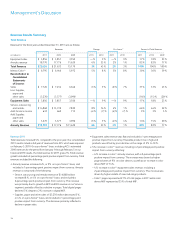
The following is a summary of our benefit plan costs and funding for
the three years ended December 31, 2011, as well as estimated amounts
for 2012:
Estimated Actual
Benefit Plan Costs: 2012 2011 2010 2009
Defined benefit
pension plans(1) $ 321 $ 284 $ 304 $ 232
Curtailment gain(2) — (107) — —
Defined contribution
plans 67 66 51 38
Retiree health
benefit plans 13 14 32 26
Total Benefit
Plan Expense $ 401 $ 257 $ 387 $ 296
(1) Estimated 2012 assumes settlement losses are consistent with 2011.
(2) Refer to the “Plan Amendment” section in Note 14 – Employee Benefit Plans in the
Consolidated Financial Statements for further information.
Our estimated 2012 defined benefit pension plan cost is expected to
be approximately $37 million higher than 2011, primarily driven by
reductions in the discount rate and the corresponding increase in service
cost as well as higher amortization of actuarial losses.
Estimated Actual
Benefit Plan Funding: 2012 2011 2010 2009
Defined benefit
pension plans $ 560 $ 556 $ 237 $ 122
Defined contribution
plans 67 66 51 38
Retiree health
benefit plans 80 73 92 107
Total Benefit
Plan Funding $ 707 $ 695 $ 380 $ 267
Holding all other assumptions constant, a 0.25% increase or decrease in
the discount rate would change the 2012 projected net periodic pension
cost by $28 million. Likewise, a 0.25% increase or decrease in the expected
return on plan assets would change the 2012 projected net periodic
pension cost by $18 million.