Xerox 2011 Annual Report Download - page 73
Download and view the complete annual report
Please find page 73 of the 2011 Xerox annual report below. You can navigate through the pages in the report by either clicking on the pages listed below, or by using the keyword search tool below to find specific information within the annual report.-
 1
1 -
2
-
3
-
4
-
5
-
6
-
7
-
8
-
9
-
10
-
11
-
12
-
13
-
14
-
15
-
16
-
17
-
18
-
19
-
20
-
21
-
22
-
23
-
24
-
25
-
26
-
27
-
28
-
29
-
30
-
31
-
32
-
33
-
34
-
35
-
36
-
37
-
38
-
39
-
40
-
41
-
42
-
43
-
44
-
45
-
46
-
47
-
48
-
49
-
50
-
51
-
52
-
53
-
54
-
55
-
56
-
57
-
58
-
59
-
60
-
61
-
62
-
 63
63 -
 64
64 -
 65
65 -
 66
66 -
 67
67 -
 68
68 -
 69
69 -
 70
70 -
 71
71 -
 72
72 -
 73
73 -
 74
74 -
 75
75 -
 76
76 -
 77
77 -
 78
78 -
 79
79 -
 80
80 -
 81
81 -
 82
82 -
 83
83 -
84
-
85
-
86
-
87
-
88
-
89
-
90
-
91
-
92
-
93
-
94
-
95
-
96
-
97
-
98
-
99
-
100
-
101
-
102
-
103
-
104
-
105
-
106
-
107
-
108
-
109
-
110
-
111
-
112
-
113
-
114
-
115
-
116
 |
 |
71Xerox 2011 Annual Report
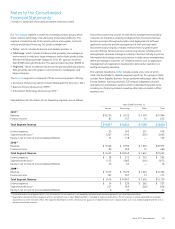
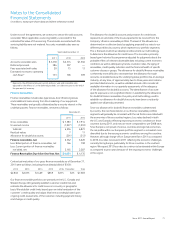
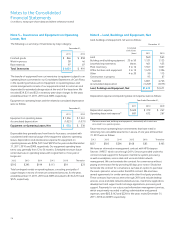
Under most of the agreements, we continue to service the sold accounts
receivable. When applicable, a servicing liability is recorded for the
estimated fair value of the servicing. The amounts associated with the
servicing liability were not material. Accounts receivable sales were as
follows:
Year Ended December 31,
2011 2010 2009
Accounts receivable sales $ 3,218 $ 2,374 $ 1,566
Deferred proceeds 386 307 —
Fees associated with sales 20 15 13
Estimated increase to operating
cash flows(1) 133 106 309
(1) Represents the difference between current and prior year-end receivable sales
adjusted for the effects of: (i) the deferred proceeds, (ii) collections prior to the end of
the year and (iii) currency.
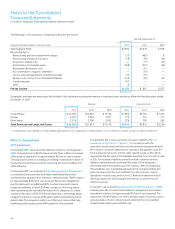
Finance Receivables
Finance receivables include sales-type leases, direct financing leases
and installment loans arising from the marketing of our equipment.
These receivables are typically collateralized by a security interest in the
underlying assets. Finance receivables, net were as follows:
December 31,
2011 2010
Gross receivables $ 7,583 $ 7,914
Unearned income (1,027) (1,093)
Subtotal 6,556 6,821
Residual values 7 11
Allowance for doubtful accounts (201) (212)
Finance receivables, net 6,362 6,620
Less: Billed portion of finance receivables, net 166 198
Less: Current portion of finance receivables
not billed, net 2,165 2,287
Finance Receivables Due After One Year, Net $ 4,031 $ 4,135
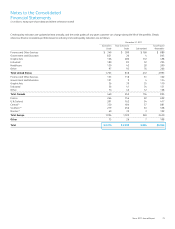
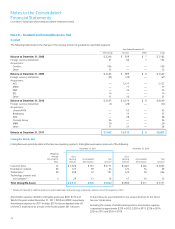
Contractual maturities of our gross finance receivables as of December 31,
2011 were as follows (including those already billed of $166):
2012 2013 2014 2015 2016 Thereafter Total
$ 2,832 $2,073 $1,469 $859 $315 $35 $7,583
Our finance receivable portfolios are primarily in the U.S., Canada and
Western Europe. We generally establish customer credit limits and
estimate the allowance for credit losses on a country or geographic
basis. We establish credit limits based upon an initial evaluation of the
customer’s credit quality and adjust that limit accordingly based upon
ongoing credit assessments of the customer, including payment history
and changes in credit quality.
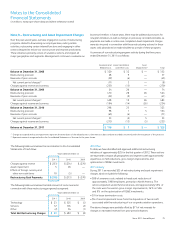
The allowance for doubtful accounts and provision for credit losses
represents an estimate of the losses expected to be incurred from the
Company’s finance receivable portfolio. The level of the allowance is
determined on a collective basis by applying projected loss rates to our
different portfolios by country, which represent our portfolio segments.
This is the level at which we develop and document our methodology
to determine the allowance for credit losses. This loss rate is primarily
based upon historical loss experience adjusted for judgments about the
probable effects of relevant observable data including current economic
conditions as well as delinquency trends, resolution rates, the aging of
receivables, credit quality indicators and the financial health of specific
customer classes or groups. The allowance for doubtful finance receivables
is inherently more difficult to estimate than the allowance for trade
accounts receivable because the underlying lease portfolio has an average
maturity, at any time, of approximately two to three years and contains
past due billed amounts, as well as unbilled amounts. We consider all
available information in our quarterly assessments of the adequacy
of the allowance for doubtful accounts. The identification of account-
specific exposure is not a significant factor in establishing the allowance
for doubtful finance receivables. Our policy and methodology used to
establish our allowance for doubtful accounts have been consistently
applied over all periods presented.
Since our allowance for doubtful finance receivables is determined
by country, the risk characteristics in our finance receivable portfolio
segments will generally be consistent with the risk factors associated with
the economies of those countries/regions. Loss rates declined in both
the U.S. and Canada, reflecting improving economic conditions in those
countries during 2011, and now are more comparable to pre-2008 rates.
Since Europe is comprised of various countries and regional economies,
the risk profile within our European portfolio segment is somewhat more
diversified due to the varying economic conditions among the countries.
However, although charge-offs in Europe were flat in 2011 as compared
to 2010, loss rates increased in 2011 reflecting the economic challenges
currently facing Europe, particularly for those countries in the southern
region. We expect 2012 loss rates to continue to be elevated within Europe
as compared to prior years because of the ongoing economic challenges
in this region.
Notes to the Consolidated
Financial Statements
(in millions, except per-share data and where otherwise noted)