Xerox 2011 Annual Report Download - page 61
Download and view the complete annual report
Please find page 61 of the 2011 Xerox annual report below. You can navigate through the pages in the report by either clicking on the pages listed below, or by using the keyword search tool below to find specific information within the annual report.-
 1
1 -
2
-
3
-
4
-
5
-
6
-
7
-
8
-
9
-
10
-
11
-
12
-
13
-
14
-
15
-
16
-
17
-
18
-
19
-
20
-
21
-
22
-
23
-
24
-
25
-
26
-
27
-
28
-
29
-
30
-
31
-
32
-
33
-
34
-
35
-
36
-
37
-
38
-
39
-
40
-
41
-
42
-
43
-
44
-
45
-
46
-
47
-
48
-
49
-
50
-
 51
51 -
 52
52 -
 53
53 -
 54
54 -
 55
55 -
 56
56 -
 57
57 -
 58
58 -
 59
59 -
 60
60 -
 61
61 -
 62
62 -
 63
63 -
 64
64 -
 65
65 -
 66
66 -
 67
67 -
 68
68 -
 69
69 -
 70
70 -
 71
71 -
72
-
73
-
74
-
75
-
76
-
77
-
78
-
79
-
80
-
81
-
82
-
83
-
84
-
85
-
86
-
87
-
88
-
89
-
90
-
91
-
92
-
93
-
94
-
95
-
96
-
97
-
98
-
99
-
100
-
101
-
102
-
103
-
104
-
105
-
106
-
107
-
108
-
109
-
110
-
111
-
112
-
113
-
114
-
115
-
116
 |
 |

59Xerox 2011 Annual Report
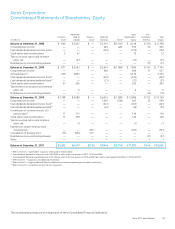
Xerox Corporation
Consolidated Statements of Shareholders’ Equity
Additional Xerox Non-
Common Paid-In Treasury Retained Shareholders’ controlling Total
(in millions) Stock(1) Capital Stock(1) Earnings AOCL(6) Equity Interests Equity
Balance at December 31, 2008 $ 866 $ 2,447 $ — $ 5,341 $ (2,416) $ 6,238 $ 120 $ 6,358
Comprehensive income — — — 485 428 913 32 945
Cash dividends declared-common stock(2) — — — (152) — (152) — (152)
Stock option and incentive plans 5 67 — — — 72 — 72
Tax loss on stock option and incentive
plans, net — (21) — — — (21) — (21)
Distributions to noncontrolling interests — — — — — — (11) (11)
Balance at December 31, 2009 $ 871 $ 2,493 $ — $ 5,674 $ (1,988) $ 7,050 $ 141 $ 7,191
Comprehensive income — — — 606 — 606 31 637
ACS Acquisition(4) 490 3,825 — — — 4,315 — 4,315
Cash dividends declared-common stock(2) — — — (243) — (243) — (243)
Cash dividends declared-preferred stock(3) — — — (21) — (21) — (21)
Stock option and incentive plans 37 256 — — — 293 — 293
Tax benefit on stock option and incentive
plans, net — 6 — — — 6 — 6
Distributions to noncontrolling interests — — — — — — (19) (19)
Balance at December 31, 2010 $ 1,398 $ 6,580 $ — $ 6,016 $ (1,988) $ 12,006 $ 153 $ 12,159
Comprehensive income — — — 1,295 (728) 567 32 599
Cash dividends declared-common stock(2) — — — (241) — (241) — (241)
Cash dividends declared-preferred stock(3) — — — (24) — (24) — (24)
Contribution of common stock to U.S.
pension plan(5) 17 113 — — — 130 — 130
Stock option and incentive plans 11 129 — — — 140 — 140
Tax loss on stock option and incentive
plans, net — (1) — — — (1) — (1)
Payments to acquire treasury stock,
including fees — — (701) — — (701) — (701)
Cancellation of treasury stock (73) (504) 577 — — — — —
Distributions to noncontrolling interests — — — — — — (37) (37)
Other — — — — — — 1 1
Balance at December 31, 2011 $ 1,353 $ 6,317 $ (124) $ 7,046 $ (2,716) $ 11,876 $ 149 $ 12,025
(1) Refer to Note 18 – Shareholders’ Equity for rollforward of related shares.
(2) Cash dividends declared on common stock of $0.0425 in each of the four quarters in 2011, 2010 and 2009.
(3) Cash dividends declared on preferred stock of $12.22 per share in the first quarter of 2010 and $20 per share in each quarter thereafter in 2010 and 2011.
(4) Refer to Note 3 – Acquisitions for additional information.
(5) Refer to Note 14 – Employee Benefit Plans for additional information regarding pension plan contributions.
(6) Refer to Note 19 – Comprehensive Income for components.
The accompanying notes are an integral part of these Consolidated Financial Statements.