Xerox 2011 Annual Report Download - page 92
Download and view the complete annual report
Please find page 92 of the 2011 Xerox annual report below. You can navigate through the pages in the report by either clicking on the pages listed below, or by using the keyword search tool below to find specific information within the annual report.-
 1
1 -
2
-
3
-
4
-
5
-
6
-
7
-
8
-
9
-
10
-
11
-
12
-
13
-
14
-
15
-
16
-
17
-
18
-
19
-
20
-
21
-
22
-
23
-
24
-
25
-
26
-
27
-
28
-
29
-
30
-
31
-
32
-
33
-
34
-
35
-
36
-
37
-
38
-
39
-
40
-
41
-
42
-
43
-
44
-
45
-
46
-
47
-
48
-
49
-
50
-
51
-
52
-
53
-
54
-
55
-
56
-
57
-
58
-
59
-
60
-
61
-
62
-
63
-
64
-
65
-
66
-
67
-
68
-
69
-
70
-
71
-
72
-
73
-
74
-
75
-
76
-
77
-
78
-
79
-
80
-
81
-
 82
82 -
 83
83 -
 84
84 -
 85
85 -
 86
86 -
 87
87 -
 88
88 -
 89
89 -
 90
90 -
 91
91 -
 92
92 -
 93
93 -
 94
94 -
 95
95 -
 96
96 -
 97
97 -
 98
98 -
 99
99 -
 100
100 -
 101
101 -
 102
102 -
103
-
104
-
105
-
106
-
107
-
108
-
109
-
110
-
111
-
112
-
113
-
114
-
115
-
116
 |
 |

90
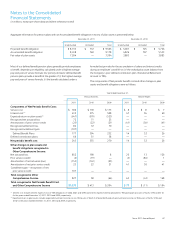
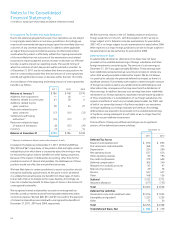
The following table presents the defined benefit plans assets measured at fair value at December 31, 2010 and the basis for that measurement:
Valuation Based on:
Quoted Prices in Significant Other Significant Total
Active Markets for Observable Unobservable Fair Value
Identical Asset Inputs Inputs December 31,
Asset Class (Level 1) (Level 2) (Level 3) 2010 % of Total
Cash and Cash Equivalents $ 640 $ — $ — $ 640 8%
Equity Securities:
U.S. Large Cap 507 54 — 561 7%
U.S. Mid Cap 84 — — 84 1%
U.S. Small Cap 60 62 — 122 2%
International Developed 1,513 514 — 2,027 26%
Emerging Markets 324 — — 324 4%
Global Equity 8 25 — 33 —%
Total Equity Securities 2,496 655 — 3,151 40%
Debt Securities:
U.S. Treasury Securities 4 209 — 213 3%
Debt Security Issued by Government Agency 75 1,011 — 1,086 14%
Corporate Bonds 167 1,412 — 1,579 20%
Asset-Backed Securities 2 15 — 17 —%
Total Debt Securities 248 2,647 — 2,895 37%
Common/Collective Trust 4 69 — 73 1%
Derivatives:
Interest Rate Contracts — 123 — 123 2%
Foreign Exchange Contracts 5 (12) — (7) —%
Equity Contracts — 53 — 53 —%
Other Contracts 66 3 — 69 1%
Total Derivatives 71 167 — 238 3%
Hedge Funds — 2 4 6 —%
Real Estate 103 73 275 451 6%
Private Equity/Venture Capital — — 308 308 4%
Guaranteed Insurance Contracts — — 96 96 1%
Other(1) 34 49 (1) 82 —%
Total Defined Benefit Plans Assets $ 3,596 $ 3,662 $ 682 $ 7,940 100%
(1) Other Level 1 assets include net non-financial assets of $27 such as due to/from broker, interest receivables and accrued expenses.
Notes to the Consolidated
Financial Statements
(in millions, except per-share data and where otherwise noted)