Xerox 2011 Annual Report Download - page 11
Download and view the complete annual report
Please find page 11 of the 2011 Xerox annual report below. You can navigate through the pages in the report by either clicking on the pages listed below, or by using the keyword search tool below to find specific information within the annual report.-
 1
1 -
 2
2 -
 3
3 -
 4
4 -
 5
5 -
 6
6 -
 7
7 -
 8
8 -
 9
9 -
 10
10 -
 11
11 -
 12
12 -
 13
13 -
 14
14 -
 15
15 -
 16
16 -
 17
17 -
 18
18 -
 19
19 -
 20
20 -
 21
21 -
 22
22 -
23
-
24
-
25
-
26
-
27
-
28
-
29
-
30
-
31
-
32
-
33
-
34
-
35
-
36
-
37
-
38
-
39
-
40
-
41
-
42
-
43
-
44
-
45
-
46
-
47
-
48
-
49
-
50
-
51
-
52
-
53
-
54
-
55
-
56
-
57
-
58
-
59
-
60
-
61
-
62
-
63
-
64
-
65
-
66
-
67
-
68
-
69
-
70
-
71
-
72
-
73
-
74
-
75
-
76
-
77
-
78
-
79
-
80
-
81
-
82
-
83
-
84
-
85
-
86
-
87
-
88
-
89
-
90
-
91
-
92
-
93
-
94
-
95
-
96
-
97
-
98
-
99
-
100
-
101
-
102
-
103
-
104
-
105
-
106
-
107
-
108
-
109
-
110
-
111
-
112
-
113
-
114
-
115
-
116
 |
 |

Xerox 2011 Annual Report 9
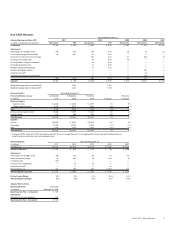
Non-GAAP Measures
Year Ended December 31,
Adjusted Earnings per Share (EPS) 2011 2010 2009 2008 2007
(in millions, except per-share amounts) Net Income EPS Net Income EPS Net Income Net Income Net Income
As Reported $ 1,295 $ 0.90 $ 606 $ 0.43 $ 485 $ 230 $ 1,135
Adjustments:
Amortization of intangible assets 248 0.17 194 0.14 38 35 28
Loss on early extinguishment of debt 20 0.01 10 0.01 — — —
Xerox and Fuji Xerox restructuring charge 355 0.26 41 308 (5)
ACS acquisition-related costs 58 0.04 49 — —
ACS shareholders’ litigation settlement 36 0.03 — — —
Venezuela devaluation costs 21 0.02 — — —
Medicare subsidy tax law change 16 0.01 — — —
Provision for litigation matters — — — 491 —
Equipment write-off — — — 24 —
Settlement of unrecognized tax benefits — — — (41) —
268 0.18 690 0.51 128 817 23
Adjusted $ 1,563 $ 1.08 $ 1,296 $ 0.94 $ 613 $ 1,047 $ 1,158
Weighted average shares for reported EPS 1,444 1,351
Weighted average shares for adjusted EPS 1,444 1,378
Revenue Growth – Year Ended December 31,
Pro-forma/Without Currency As Reported As Reported Pro-forma Pro-forma
(in millions) 2011 2010 2010(1) % Change % Change
Revenue Category
Equipment sales $ 3,856 $ 3,857 $ 3,857 0% 0%
Supplies, paper and other 3,270 3,377 3,402 (3%) (4%)
Sales 7,126 7,234 7,259 (1%) (2%)
Service, outsourcing and rentals 14,868 13,739 14,333 8% 4%
Finance income 632 660 660 (4%) (4%)
Total Revenues $ 22,626 $ 21,633 $ 22,252 5% 2%
Segment
Services $ 10,837 $ 9,637 $ 10,256 12% 6%
Technology 10,259 10,349 10,349 (1%) (1%)
Other 1,530 1,647 1,647 (7%) (7%)
Total Revenues $ 22,626 $ 21,633 $ 22,252 5% 2%
(1) Pro-forma 2010 includes ACS’s 2010 estimated results from January 1 through February 5 in our reported 2010 results adjusted for deferred revenue,
exited businesses and certain non-recurring product sales.
Operating Margin Year Ended December 31,
(in millions) 2011 2010 2009 2008 2007
Total Revenues $ 22,626 $ 21,633 $ 15,179 $ 17,608 $ 17,228
Pre-tax income (loss) $ 1,565 $ 815 $ 627 $ (79) $ 1,468
Adjustments:
Amortization of intangible assets 398 312 60 54 42
Xerox restructuring charge 33 483 (8) 429 (6)
Curtailment gain (107) — — — —
ACS acquisition-related costs — 77 72 — —
Equipment write-off — — — 39 —
Other expenses, net 322 389 285 1,033 223
Adjusted Operating Income $ 2,211 $ 2,076 $ 1,036 $ 1,476 $ 1,727
Pre-tax Income Margin 6.9% 3.8% 4.1% (0.4%) 8.5%
Adjusted Operating Margin 9.8% 9.6% 6.8% 8.4% 10.0%
Adjusted Net Cash from
Operating Activities Year Ended
(in millions) December 31, 2008
Operating Cash Flow – As Reported $ 939
Adjustments:
Payments for securities litigation 615
Operating Cash flow – As Adjusted $ 1,554