Xerox 2011 Annual Report Download - page 105
Download and view the complete annual report
Please find page 105 of the 2011 Xerox annual report below. You can navigate through the pages in the report by either clicking on the pages listed below, or by using the keyword search tool below to find specific information within the annual report.-
 1
1 -
2
-
3
-
4
-
5
-
6
-
7
-
8
-
9
-
10
-
11
-
12
-
13
-
14
-
15
-
16
-
17
-
18
-
19
-
20
-
21
-
22
-
23
-
24
-
25
-
26
-
27
-
28
-
29
-
30
-
31
-
32
-
33
-
34
-
35
-
36
-
37
-
38
-
39
-
40
-
41
-
42
-
43
-
44
-
45
-
46
-
47
-
48
-
49
-
50
-
51
-
52
-
53
-
54
-
55
-
56
-
57
-
58
-
59
-
60
-
61
-
62
-
63
-
64
-
65
-
66
-
67
-
68
-
69
-
70
-
71
-
72
-
73
-
74
-
75
-
76
-
77
-
78
-
79
-
80
-
81
-
82
-
83
-
84
-
85
-
86
-
87
-
88
-
89
-
90
-
91
-
92
-
93
-
94
-
 95
95 -
 96
96 -
 97
97 -
 98
98 -
 99
99 -
 100
100 -
 101
101 -
 102
102 -
 103
103 -
 104
104 -
 105
105 -
 106
106 -
 107
107 -
 108
108 -
 109
109 -
 110
110 -
 111
111 -
 112
112 -
 113
113 -
 114
114 -
 115
115 -
116
 |
 |

103Xerox 2011 Annual Report
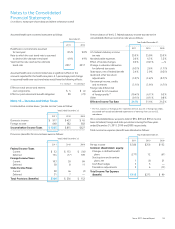
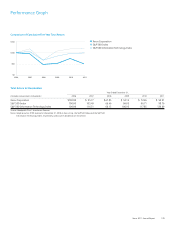
Note 20 – Earnings per Share
The following table sets forth the computation of basic and diluted earnings per share of common stock (shares in thousands):
Year Ended December 31,
2011 2010 2009
Basic Earnings per Share:
Net income attributable to Xerox $ 1,295 $ 606 $ 485
Accrued dividends on preferred stock (24) (21) —
Adjusted Net Income Available to Common Shareholders $ 1,271 $ 585 $ 485
Weighted-average common shares outstanding 1,388,096 1,323,431 869,979
Basic Earnings per Share $ 0.92 $ 0.44 $ 0.56
Diluted Earnings per Share:
Net income attributable to Xerox $ 1,295 $ 606 $ 485
Accrued dividends on preferred stock — (21) —
Interest on Convertible Securities, net 1 — 1
Adjusted Net Income Available to Common Shareholders $ 1,296 $ 585 $ 486
Weighted-average common shares outstanding 1,388,096 1,323,431 869,979
Common shares issuable with respect to:
Stock options 9,727 13,497 462
Restricted stock and performance shares 16,993 13,800 7,087
Convertible preferred stock 26,966 — —
Convertible securities 1,992 — 1,992
Adjusted Weighted-Average Common Shares Outstanding 1,443,774 1,350,728 879,520
Diluted Earnings per Share $ 0.90 $ 0.43 $ 0.55
The following securities were not included in the computation of diluted
earnings per share because to do so would have been anti-dilutive:
Stock options 40,343 57,541 27,901
Restricted stock and performance shares 26,018 25,983 22,574
Convertible preferred stock — 26,966 —
Convertible securities — 1,992 —
66,361 112,482 50,475
Dividends per Common Share $ 0.17 $ 0.17 $ 0.17
Notes to the Consolidated
Financial Statements
(in millions, except per-share data and where otherwise noted)