Xerox 2011 Annual Report Download - page 19
Download and view the complete annual report
Please find page 19 of the 2011 Xerox annual report below. You can navigate through the pages in the report by either clicking on the pages listed below, or by using the keyword search tool below to find specific information within the annual report.-
 1
1 -
2
-
3
-
4
-
5
-
6
-
7
-
8
-
 9
9 -
 10
10 -
 11
11 -
 12
12 -
 13
13 -
 14
14 -
 15
15 -
 16
16 -
 17
17 -
 18
18 -
 19
19 -
 20
20 -
 21
21 -
 22
22 -
 23
23 -
 24
24 -
 25
25 -
 26
26 -
 27
27 -
 28
28 -
 29
29 -
30
-
31
-
32
-
33
-
34
-
35
-
36
-
37
-
38
-
39
-
40
-
41
-
42
-
43
-
44
-
45
-
46
-
47
-
48
-
49
-
50
-
51
-
52
-
53
-
54
-
55
-
56
-
57
-
58
-
59
-
60
-
61
-
62
-
63
-
64
-
65
-
66
-
67
-
68
-
69
-
70
-
71
-
72
-
73
-
74
-
75
-
76
-
77
-
78
-
79
-
80
-
81
-
82
-
83
-
84
-
85
-
86
-
87
-
88
-
89
-
90
-
91
-
92
-
93
-
94
-
95
-
96
-
97
-
98
-
99
-
100
-
101
-
102
-
103
-
104
-
105
-
106
-
107
-
108
-
109
-
110
-
111
-
112
-
113
-
114
-
115
-
116
 |
 |
17Xerox 2011 Annual Report
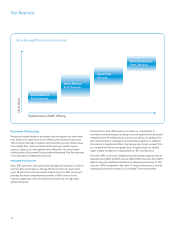
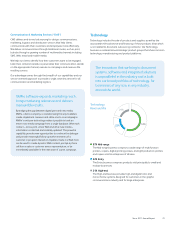
Investment in R&D is critical for competitiveness in our fast-paced
markets. One of the ways that we maintain our market leadership is
through strategic coordination of our R&D with Fuji Xerox (an equity
investment in which we maintain a 25 percent ownership interest). We
have aligned our R&D investment portfolio with our growth initiatives,
including accelerating our color transition and enhancing customer
value by building on our Services leadership.
Sustaining engineering expenses, which are the hardware engineering
and software development costs we incur after we launch a product,
are included in our RD&E expenses.
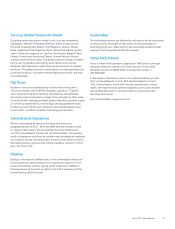
RD&E Expenses
(in millions)
R&D
n Sustaining Engineering
Fuji Xerox invested $880
million in R&D in 2011,
$821 million in 2010 and
$796 million in 2009.
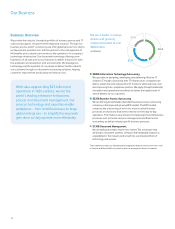
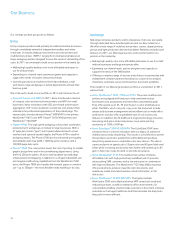
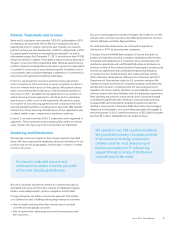
Segment Information
Our reportable segments are Services, Technology and Other. We present
operating segment financial information in Note 2 – Segment Reporting
in the Consolidated Financial Statements, which we incorporate by
reference here. We have a very broad and diverse base of customers by
both geography and industry, ranging from small and midsize businesses
(“SMBs”) to graphic communications companies, governmental entities,
educational institutions and Fortune 1000 corporate accounts. None
of our business segments depends upon a single customer, or a few
customers, the loss of which would have a material adverse effect on
our business.
n $10,837 Services
Our Services segment comprises three service offerings: Business
Process Outsourcing (“BPO”), Information Technology Outsourcing
(“ITO”) and Document Outsourcing (“DO”).
n $10,259 Technology
Technology includes the sale of products and supplies,
as well as the associated technical service and financing of those
products.
n $1,530 Other
The Other segment primarily includes revenue from paper sales,
wide-format systems, and GIS network integration solutions and
electronic presentation systems.
Revenues by
Business Segment
(in millions)
$10,837
$10,259
$1,530
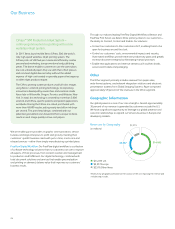
Services
Our Services segment comprises three service offerings: Business Process
Outsourcing (“BPO”), Information Technology Outsourcing (“ITO”) and
Document Outsourcing (“DO”). We provide non-core, mission-critical
services that our clients need to run their day-to-day business. The
services help our clients simplify the way work gets done, giving them
more time and resources to allocate to their core operations, respond
rapidly to changing technologies, and reduce expenses associated with
their business processes and information technology support.
The cost and complexities of smoothly
and securely running back-office operations
can be a distraction from focusing on
core business. That’s why enterprises
turn to partners who specialize in key
business processes.
$781
’10
$653
$128
$613
$108
$721
’11
$840
’09
$713
$127