Xerox 2011 Annual Report Download - page 103
Download and view the complete annual report
Please find page 103 of the 2011 Xerox annual report below. You can navigate through the pages in the report by either clicking on the pages listed below, or by using the keyword search tool below to find specific information within the annual report.-
 1
1 -
2
-
3
-
4
-
5
-
6
-
7
-
8
-
9
-
10
-
11
-
12
-
13
-
14
-
15
-
16
-
17
-
18
-
19
-
20
-
21
-
22
-
23
-
24
-
25
-
26
-
27
-
28
-
29
-
30
-
31
-
32
-
33
-
34
-
35
-
36
-
37
-
38
-
39
-
40
-
41
-
42
-
43
-
44
-
45
-
46
-
47
-
48
-
49
-
50
-
51
-
52
-
53
-
54
-
55
-
56
-
57
-
58
-
59
-
60
-
61
-
62
-
63
-
64
-
65
-
66
-
67
-
68
-
69
-
70
-
71
-
72
-
73
-
74
-
75
-
76
-
77
-
78
-
79
-
80
-
81
-
82
-
83
-
84
-
85
-
86
-
87
-
88
-
89
-
90
-
91
-
92
-
 93
93 -
 94
94 -
 95
95 -
 96
96 -
 97
97 -
 98
98 -
 99
99 -
 100
100 -
 101
101 -
 102
102 -
 103
103 -
 104
104 -
 105
105 -
 106
106 -
 107
107 -
 108
108 -
 109
109 -
 110
110 -
 111
111 -
 112
112 -
 113
113 -
114
-
115
-
116
 |
 |
101Xerox 2011 Annual Report
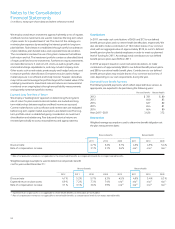
As of December 31, 2011, there was $23 of total unrecognized
compensation cost related to nonvested stock options. This cost is
expected to be recognized ratably over a remaining weighted-average
vesting period of 2.6 years.
Information relating to options outstanding and exercisable at
December 31, 2011 was as follows:
Options Outstanding Options Exercisable
Aggregate intrinsic value $119 $102
Weighted-average remaining
contractual life in years 4.3 3.5
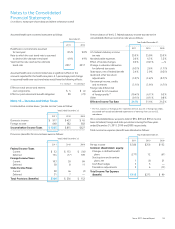
The following table provides information relating to stock option
exercises:
Year Ended December 31,
2011 2010 2009
Total intrinsic value of
stock options $18 $155 $ —
Cash received 44 183 1
Tax benefit realized for stock
option tax deductions 7 56 —
The following table provides information relating to the status of, and changes in, outstanding stock options (stock options in thousands):
2011 2010 2009
Weighted Weighted Weighted
Stock Average Stock Average Stock Average
Employee Stock Options Options Option Price Options Option Price Options Option Price
Outstanding at January 1 71,038 $8.00 28,363 $10.13 45,185 $15.49
Granted – ACS acquisition — — 96,662 6.79 — —
Canceled/Expired (14,889) 8.38 (2,735) 7.33 (16,676) 24.68
Exercised (6,079) 8.21 (51,252) 6.92 (146) 5.88
Outstanding at December 31 50,070 6.98 71,038 8.00 28,363 10.13
Exercisable at December 31 39,987 7.14 57,985 8.38 28,363 10.13
Notes to the Consolidated
Financial Statements
(in millions, except per-share data and where otherwise noted)