Xerox 2011 Annual Report Download - page 33
Download and view the complete annual report
Please find page 33 of the 2011 Xerox annual report below. You can navigate through the pages in the report by either clicking on the pages listed below, or by using the keyword search tool below to find specific information within the annual report.-
 1
1 -
2
-
3
-
4
-
5
-
6
-
7
-
8
-
9
-
10
-
11
-
12
-
13
-
14
-
15
-
16
-
17
-
18
-
19
-
20
-
21
-
22
-
 23
23 -
 24
24 -
 25
25 -
 26
26 -
 27
27 -
 28
28 -
 29
29 -
 30
30 -
 31
31 -
 32
32 -
 33
33 -
 34
34 -
 35
35 -
 36
36 -
 37
37 -
 38
38 -
 39
39 -
 40
40 -
 41
41 -
 42
42 -
 43
43 -
44
-
45
-
46
-
47
-
48
-
49
-
50
-
51
-
52
-
53
-
54
-
55
-
56
-
57
-
58
-
59
-
60
-
61
-
62
-
63
-
64
-
65
-
66
-
67
-
68
-
69
-
70
-
71
-
72
-
73
-
74
-
75
-
76
-
77
-
78
-
79
-
80
-
81
-
82
-
83
-
84
-
85
-
86
-
87
-
88
-
89
-
90
-
91
-
92
-
93
-
94
-
95
-
96
-
97
-
98
-
99
-
100
-
101
-
102
-
103
-
104
-
105
-
106
-
107
-
108
-
109
-
110
-
111
-
112
-
113
-
114
-
115
-
116
 |
 |
Management’s Discussion
31Xerox 2011 Annual Report
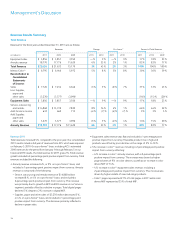
Allowance for Doubtful Accounts and Credit Losses
We perform ongoing credit evaluations of our customers and adjust credit
limits based upon customer payment history and current creditworthiness.
We continuously monitor collections and payments from our customers
and maintain a provision for estimated credit losses based upon our
historical experience adjusted for current conditions. We cannot guarantee
that we will continue to experience credit loss rates similar to those
we have experienced in the past. Measurement of such losses requires
consideration of historical loss experience, including the need to adjust
for current conditions, and judgments about the probable effects of
relevant observable data, including present economic conditions such as
delinquency rates and financial health of specific customers. We recorded
bad debt provisions of $157 million, $188 million and $291 million in SAG
expenses in our Consolidated Statements of Income for the years ended
December 31, 2011, 2010 and 2009, respectively.
Historically, the majority of the bad debt provision is related to our finance
receivables portfolio. This provision is inherently more difficult to estimate
than the provision for trade accounts receivable because the underlying
lease portfolio has an average maturity, at any time, of approximately two
to three years and contains past due billed amounts, as well as unbilled
amounts. The estimated credit quality of any given customer and class
of customer or geographic location can significantly change during the
life of the portfolio. We consider all available information in our quarterly
assessments of the adequacy of the provision for doubtful accounts.
Bad debt provisions decreased by $31 million in 2011. Reserves as
a percentage of trade and finance receivables were 3.3% at both
December 31, 2011 and 2010 and 4.1% at December 31, 2009.
The improving trend in write-offs for the U.S. and Canada was offset
by higher write-offs in Southern Europe. We continue to assess our
receivable portfolio in light of the current economic environment and
its impact on our estimation of the adequacy of the allowance for
doubtful accounts. Refer to Note 4 – Receivables, Net in the Consolidated
Financial Statements for additional information.
As discussed above, in preparing our Consolidated Financial Statements
for the three years ended December 31, 2011, we estimated our provision
for doubtful accounts based on historical experience and customer-
specific collection issues. This methodology was consistently applied for
all periods presented. During the five-year period ended December 31,
2011, our reserve for doubtful accounts ranged from 3.1% to 4.1% of
gross receivables. Holding all assumptions constant, a 1-percentage point
increase or decrease in the reserve from the December 31, 2011 rate of
3.3% would change the 2011 provision by approximately $93 million.
Pension and Retiree Health Benefit Plan Assumptions
We sponsor defined benefit pension plans in various forms in several
countries covering employees who meet eligibility requirements. Retiree
health benefit plans cover U.S. and Canadian employees for retirement
medical costs. Several statistical and other factors that attempt to
anticipate future events are used in calculating the expense, liability
and asset values related to our pension and retiree health benefit plans.
These factors include assumptions we make about the discount rate,
expected return on plan assets, rate of increase in healthcare costs, the
rate of future compensation increases and mortality. Differences between
these assumptions and actual experiences are reported as net actuarial
gains and losses and are subject to amortization to net periodic benefit
cost generally over the average remaining service lives of the employees
participating in the plans. In plans where substantially all participants are
inactive, the amortization period for net actuarial gains and losses is the
average remaining life expectancy of the plan participants.
Cumulative actuarial losses for our defined benefit pension plans of
$2.6 billion as of December 31, 2011 increased by approximately $700
million from December 31, 2010. The increase reflects the increase in our
benefit obligations as a result of a lower discount rate, which was only
partially offset by positive returns on plan assets in 2011 as compared
to expected returns. The total actuarial loss will be amortized over future
periods, subject to offsetting gains or losses that will impact the future
amortization amounts.
We used a weighted average expected rate of return on plan assets of
7.2% for 2011, 7.3% for 2010 and 7.4% for 2009, on a worldwide basis.
During 2011, the actual return on plan assets was $694 million. When
estimating the 2012 expected rate of return, in addition to assessing
recent performance, we considered the historical returns earned on plan
assets, the rates of return expected in the future, particularly in light of
current economic conditions, and our investment strategy and asset mix
with respect to the plans’ funds. The weighted average expected rate of
return on plan assets we will use in 2012 is 6.9%. The reduction in the
expected rate of return in 2012 as compared to 2011 reflects the expected
decrease in long-term capital market returns for all asset categories.
For purposes of determining the expected return on plan assets, we use
a calculated value approach to determine the value of the pension plan
assets, rather than a fair market value approach. The primary difference
between these two methods relates to a systematic recognition of
changes in fair value over time (generally two years) versus immediate
recognition of changes in fair value. Our expected rate of return on plan
assets is applied to the calculated asset value to determine the amount
of the expected return on plan assets to be used in the determination of
the net periodic pension cost. The calculated value approach reduces the
volatility in net periodic pension cost that can result from using the fair
market value approach. The difference between the actual return on plan
assets and the expected return on plan assets is added to, or subtracted
from, any cumulative differences from prior years. This amount is a
component of the net actuarial gain or loss.
Another significant assumption affecting our pension and retiree health
benefit obligations and the net periodic benefit cost is the rate that we
use to discount our future anticipated benefit obligations. The discount
rate reflects the current rate at which the benefit liabilities could be
effectively settled considering the timing of expected payments for plan
participants. In estimating this rate, we consider rates of return on high-
quality, fixed-income investments included in published bond indices,
adjusted to eliminate the effects of call provisions and differences in the
timing and amounts of cash outflows related to the bonds. In the U.S.