Xerox 2011 Annual Report Download - page 31
Download and view the complete annual report
Please find page 31 of the 2011 Xerox annual report below. You can navigate through the pages in the report by either clicking on the pages listed below, or by using the keyword search tool below to find specific information within the annual report.-
 1
1 -
2
-
3
-
4
-
5
-
6
-
7
-
8
-
9
-
10
-
11
-
12
-
13
-
14
-
15
-
16
-
17
-
18
-
19
-
20
-
 21
21 -
 22
22 -
 23
23 -
 24
24 -
 25
25 -
 26
26 -
 27
27 -
 28
28 -
 29
29 -
 30
30 -
 31
31 -
 32
32 -
 33
33 -
 34
34 -
 35
35 -
 36
36 -
 37
37 -
 38
38 -
 39
39 -
 40
40 -
 41
41 -
42
-
43
-
44
-
45
-
46
-
47
-
48
-
49
-
50
-
51
-
52
-
53
-
54
-
55
-
56
-
57
-
58
-
59
-
60
-
61
-
62
-
63
-
64
-
65
-
66
-
67
-
68
-
69
-
70
-
71
-
72
-
73
-
74
-
75
-
76
-
77
-
78
-
79
-
80
-
81
-
82
-
83
-
84
-
85
-
86
-
87
-
88
-
89
-
90
-
91
-
92
-
93
-
94
-
95
-
96
-
97
-
98
-
99
-
100
-
101
-
102
-
103
-
104
-
105
-
106
-
107
-
108
-
109
-
110
-
111
-
112
-
113
-
114
-
115
-
116
 |
 |
Management’s Discussion
29Xerox 2011 Annual Report
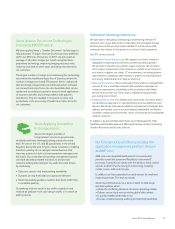
In addition, we acquired companies during 2011 that expand our
distribution capacity for Xerox technology to small and midsize businesses
(“SMB”) and in under-penetrated markets:
•In February 2011, we acquired Concept Group, Ltd. This acquisition
expands our reach into the SMB market in the U.K.
•In December 2011, we acquired the Merizon Group Incorporated,
which operates MBM, a Wisconsin-based office products distributor.
We also acquired office product distributors in Iowa, New York, Illinois,
Virginia and Florida.
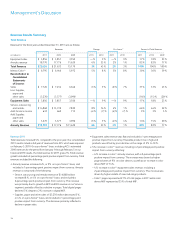
Financial Overview
Total revenue of $22.6 billion in 2011 grew 5% from the prior year,
including a 2-percentage point favorable impact from currency. To provide
a clearer comparison of our year-over-year results, we are also providing
a discussion and analysis on a pro-forma basis for the full year, where we
include ACS’s 2010 estimated results from January 1 through February
5 in our historical 2010 results. On a pro-forma(1) basis, total revenue for
2011 increased 2%, including a 2-percentage point favorable impact
from currency. Total revenue growth was primarily driven by increased
revenues in our Services segment, which grew by 12% in 2011 or 6% on
a pro-forma(1) basis, reflecting strong performance in BPO and DO services.
Technology revenues in 2011 declined 1% from the prior year and
included a 2-percentage point favorable impact from currency. Technology
revenues in 2011 were impacted by macro conditions, including the
natural disaster in Japan in the first quarter and economic weakness in
Europe, particularly in the fourth quarter.
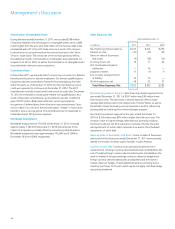
Net income attributable to Xerox for 2011 was $1.3 billion and included
$305 million of after-tax costs and expenses related to the amortization of
intangible assets, restructuring, and the loss on the early extinguishment
of a long-term liability, which were partially offset by an after-tax
curtailment gain of $66 million. Net income attributable to Xerox for
2010 was $606 million and included $690 million of after-tax costs and
expenses related to the amortization of intangible assets, restructuring,
acquisition-related costs and other discrete items. The improvement in
net income reflects continued operational cost savings from restructuring
and productivity improvements that more than offset the impacts from
economic events.
Cash flow from operations was $2.0 billion in 2011 as compared to $2.7
billion in 2010. The decrease reflects increased cash usage in 2011 for
working capital, higher pension contributions and investments associated
with new services contracts. Cash used in investing activities of $675
million primarily reflects capital expenditures of $501 million and
acquisitions of $212 million. Cash used in financing activities was $1.6
billion, which includes the redemption of Xerox Capital Trust’s $650 million
preferred securities, the scheduled repayment of $750 million of Senior
Notes and net payments of $200 million on Commercial Paper, partially
offset by the issuance of $1.0 billion in Senior Notes. Financing activities
also reflect $701 million for the repurchase of common stock and $265
million for dividends.
Total revenue is expected to grow modestly in 2012, reflecting the
mix of continued solid growth in our services business, partially offset
by continued pressure in our technology business, which is impacted
by challenging economic conditions, especially in Europe. The steady
progress we’ve made in increasing signings for our diverse service
offerings positions us well to accelerate revenue growth from Services in
2012. In our Technology business, we expect that Xerox’s competitively
advantaged product portfolio and expanded distribution will drive an
increase in installs of Xerox equipment, maintaining our leadership in
document technology.
We expect to continue our focus on cost management and productivity
improvements. This will help offset the potential impact from unfavorable
currency movements, pension expense and funding requirements, near-
term impact of new Services contracts and economic uncertainty.
Our 2012 balance sheet and cash flow strategy includes: sustaining our
working capital improvements; leveraging of our financing assets (finance
receivables and equipment on operating leases); achieving an optimal
cost of capital; and effectively deploying cash to maximize shareholder
value through share repurchases, acquisitions and dividends.
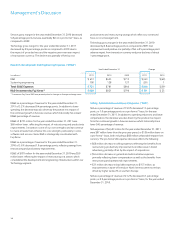
Europe
As of and for the year ended December 31, 2011, approximately $3.5
billion of our total revenues and $3.3 billion of our total assets are based
in countries where the Euro is the functional currency. Approximately $1.9
billion of those assets are finance receivables and approximately 16%
of those receivables are with governmental entities. Accordingly, we are
impacted by the significant challenges facing the Euro Zone economies
and governments, and we expect those negative impacts to continue in
2012 mainly with respect to revenue growth and bad debt provisions.
Currency Impact
To understand the trends in the business, we believe that it is helpful to
analyze the impact of changes in the translation of foreign currencies
into U.S. Dollars on revenue and expenses. We refer to this analysis
as “currency impact” or “the impact from currency.” This impact is
calculated by translating current-period activity in local currency using
the comparable prior-year period’s currency translation rate. This impact
is calculated for all countries where the functional currency is the local
country currency. Revenues and expenses from our developing market
countries (Latin America, Brazil, the Middle East, India, Eurasia and Central-
Eastern Europe) are analyzed at actual exchange rates for all periods
presented, since these countries generally have unpredictable currency
and inflationary environments, and our operations in these countries have
historically implemented pricing actions to recover the impact of inflation
and devaluation. We do not hedge the translation effect of revenues
or expenses denominated in currencies where the local currency is the
functional currency.