Xerox 2011 Annual Report Download - page 45
Download and view the complete annual report
Please find page 45 of the 2011 Xerox annual report below. You can navigate through the pages in the report by either clicking on the pages listed below, or by using the keyword search tool below to find specific information within the annual report.-
 1
1 -
2
-
3
-
4
-
5
-
6
-
7
-
8
-
9
-
10
-
11
-
12
-
13
-
14
-
15
-
16
-
17
-
18
-
19
-
20
-
21
-
22
-
23
-
24
-
25
-
26
-
27
-
28
-
29
-
30
-
31
-
32
-
33
-
34
-
 35
35 -
 36
36 -
 37
37 -
 38
38 -
 39
39 -
 40
40 -
 41
41 -
 42
42 -
 43
43 -
 44
44 -
 45
45 -
 46
46 -
 47
47 -
 48
48 -
 49
49 -
 50
50 -
 51
51 -
 52
52 -
 53
53 -
 54
54 -
 55
55 -
56
-
57
-
58
-
59
-
60
-
61
-
62
-
63
-
64
-
65
-
66
-
67
-
68
-
69
-
70
-
71
-
72
-
73
-
74
-
75
-
76
-
77
-
78
-
79
-
80
-
81
-
82
-
83
-
84
-
85
-
86
-
87
-
88
-
89
-
90
-
91
-
92
-
93
-
94
-
95
-
96
-
97
-
98
-
99
-
100
-
101
-
102
-
103
-
104
-
105
-
106
-
107
-
108
-
109
-
110
-
111
-
112
-
113
-
114
-
115
-
116
 |
 |

Management’s Discussion
43Xerox 2011 Annual Report
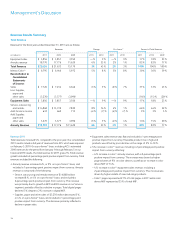
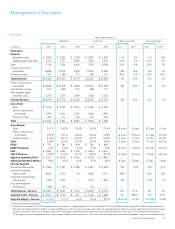
SegmentMargin2010
Technology segment margin of 10.5% increased 1.1-percentage points
from the prior-year period. Lower cost and expense from restructuring
savings, in addition to an increase in equity in net income from
unconsolidated affiliates, more than offset the gross margin decline.
Installs2010
Entry
•46% increase in installs of A4 black-and-white multifunction devices,
driven by growth in developing markets and indirect channels.
•39% increase in installs of A4 color multifunction devices, driven by
demand for new products.
•4% increase in installs of color printers.
Mid-range
•4%increaseininstallsofmid-rangeblack-and-whitedevices.
•27% increase in installs of mid-range color devices, primarily driven
by demand for new products such as the Xerox Color 550/560,
WorkCentre 7545/7556 and WorkCentre 7120/7700, and the
continued strong demand for the ColorQube.
High-end
•8% decrease in installs of high-end black-and-white systems, reflecting
declines across most product areas.
•26% increase in installs of high-end color systems, reflecting strong
demand for the recently launched Xerox Color 800 and 1000.
Install activity percentages include installations for Document Outsourcing
and the Xerox-branded product shipments to GIS. Descriptions of “Entry,”
“Mid-range” and “High-end” are defined in Note 2 – Segment Reporting in
the Consolidated Financial Statements.
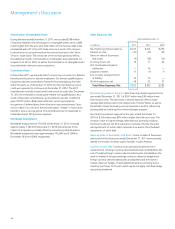
Other
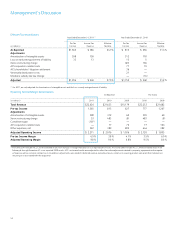
Revenue2011
Other segment revenue of $1,530 million decreased 7%, including a
2-percentage point positive impact from currency, due to a decline in
paper sales, wide format systems and other supplies, partially offset by an
increase in revenue from patent sales and licensing as noted below. Paper
comprised approximately 59% of the 2011 Other segment revenue.
In the fourth quarter of 2011, we entered into an agreement with another
company that included, among other items, the sale of certain patents
and the cross-licensing of certain patents of each party, pursuant to which
we received an up-front payment with the remaining amount payable in
two equal annual installment payments. Consistent with our accounting
policy for these transactions, revenue associated with this agreement will
be recorded as earned and only to the extent of cash received. During
the fourth quarter 2011, the Other segment included revenue and pre-tax
income/segment profit of approximately $32 million and $26 million
($16 million after-tax), respectively, which is net of certain expenses paid
in connection with this agreement. We expect to recognize additional
revenue and pre-tax income/segment profit of approximately $12 million
and $8 million ($5 million after-tax), respectively, in each of the next two
years in the Other Segment related to this agreement.
SegmentLoss2011
Other segment loss of $255 million improved $87 million from the
prior year, primarily driven by lower non-financing interest expense and
SAG expense.
Revenue2010
Other segment revenue of $1,647 million increased 1%, including a
negligible impact from currency. Increases in GIS’s network integration
and electronic presentation systems and wide format sales offset a decline
in paper sales. Paper comprised approximately 58% of the 2010 Other
segment revenue.
SegmentLoss2010
Other segment loss of $342 million was flat from the prior year, as higher
gross profit, reflecting an increase in gross margins from the mix of
revenues, was partially offset by higher interest expense associated with
funding for the ACS acquisition.
(1)
Results are discussed primarily on a pro-forma basis and include ACS’s estimated
results from January 1 through February 5 in 2010 and ACS’s estimated results from
February 6 through December 31 in 2009. See the “Non-GAAP Financial Measures”
section for an explanation of these non-GAAP financial measures.
(2) Color revenues and pages represent revenues and pages from color-enabled devices
and is a subset of total revenues and excludes Global Imaging Systems, Inc. (“GIS”).
(3) See the “Non-GAAP Financial Measures” section for an explanation of this non-GAAP
financial measure.
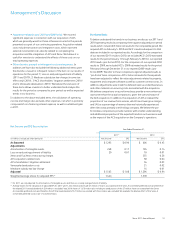
Capital Resources and Liquidity
Our ability to maintain positive liquidity going forward depends on our
ability to continue to generate cash from operations and access the
financial capital markets, both of which are subject to general economic,
financial, competitive, legislative, regulatory and other market factors that
are beyond our control.
•As of December 31, 2011 and 2010, total cash and cash equivalents
were $902 million and $1.2 billion, respectively, borrowings under
our Commercial Paper Programs were $100 million and $300 million,
respectively, and there were no outstanding borrowings or letters
of credit under our $2 billion Credit Facility for either year-end. The
decrease in our cash balance was largely due to the use of a portion of
our cash balance to fund share repurchases in 2011.
•Our Commercial Paper program was established in 2010 as a means to
reduce our cost of capital and to provide us with an additional liquidity
vehicle in the market. Aggregate Commercial Paper and Credit Facility
borrowings may not exceed the borrowing capacity under our Credit
Facility at any time.
•Over the past three years we have consistently delivered strong cash
flow from operations, driven by the strength of our annuity-based
revenue model. Cash flows from operations were $1,961 million,
$2,726 million and $2,208 million for the three years ended December
31, 2011, respectively. We expect cash flows from operations of
between $2.0 and $2.3 billion for 2012.