Xerox 2011 Annual Report Download - page 111
Download and view the complete annual report
Please find page 111 of the 2011 Xerox annual report below. You can navigate through the pages in the report by either clicking on the pages listed below, or by using the keyword search tool below to find specific information within the annual report.-
 1
1 -
2
-
3
-
4
-
5
-
6
-
7
-
8
-
9
-
10
-
11
-
12
-
13
-
14
-
15
-
16
-
17
-
18
-
19
-
20
-
21
-
22
-
23
-
24
-
25
-
26
-
27
-
28
-
29
-
30
-
31
-
32
-
33
-
34
-
35
-
36
-
37
-
38
-
39
-
40
-
41
-
42
-
43
-
44
-
45
-
46
-
47
-
48
-
49
-
50
-
51
-
52
-
53
-
54
-
55
-
56
-
57
-
58
-
59
-
60
-
61
-
62
-
63
-
64
-
65
-
66
-
67
-
68
-
69
-
70
-
71
-
72
-
73
-
74
-
75
-
76
-
77
-
78
-
79
-
80
-
81
-
82
-
83
-
84
-
85
-
86
-
87
-
88
-
89
-
90
-
91
-
92
-
93
-
94
-
95
-
96
-
97
-
98
-
99
-
100
-
 101
101 -
 102
102 -
 103
103 -
 104
104 -
 105
105 -
 106
106 -
 107
107 -
 108
108 -
 109
109 -
 110
110 -
 111
111 -
 112
112 -
 113
113 -
 114
114 -
 115
115 -
 116
116
 |
 |

109Xerox 2011 Annual Report
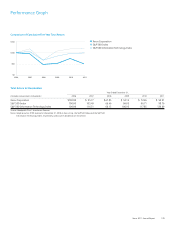
Comparison of Cumulative Five-Year Total Return
Total Return to Shareholders
Year Ended December 31,
(Includes reinvestment of dividends) 2006 2007 2008 2009 2010 2011
Xerox Corporation $100.00 $ 95.77 $47.85 $ 52.15 $ 72.26 $ 50.91
S&P 500 Index 100.00 105.49 66.46 84.05 96.71 98.76
S&P 500 Information Technology Index 100.00 116.31 66.13 106.95 117.85 120.69
Source: Standard & Poor’s Investment Services.
Notes: Graph assumes $100 invested on December 31, 2006 in Xerox Corp., the S&P 500 Index and the S&P 500
Information Technology Index, respectively, and assumes dividends are reinvested.
n
Xerox Corporation
n S&P 500 Index
n S&P 500 Information Technology Index
$150
$100
$50
$0
2006 2007 2008 2009 2010 2011
Performance Graph